Alkalinity and buffering: the hidden control of pH drift
Contents
Standfirst: After reading this article you will be able to tell alkalinity apart from pH, convert between the units in which laboratories report it, explain from the carbonate equilibrium why a running system drifts upwards in pH, and calculate how many millilitres of nitric or phosphoric acid a tank needs and how much nitrogen or phosphorus that dose adds to the recipe.
Before you read: Water quality, pH.
Alkalinity is an amount; pH is a ratio
Alkalinity is the capacity of a water to neutralise acid1,2,3. It is a quantity of base, measured by titration: the laboratory adds standard acid to a sample until the pH falls to an end point of 4.5 and reports the acid consumed as an equivalent mass of calcium carbonate3. In natural waters almost all of that capacity is carried by two ions, bicarbonate (HCO₃⁻) and carbonate (CO₃²⁻), with small contributions from hydroxide and, in some waters, borates, phosphates and silicates2,3.
pH measures something different: the concentration of hydrogen ions at one moment, as pH explained. It says nothing about how much base is waiting to absorb the next dose of acid. That is why, in Bailey’s comparison of two growers’ waters, the one at pH 8.3 with 310 mg/L of alkalinity needed more than four times the acid of the one at pH 9.3 with 71 mg/L1. “Alkaline” only means a pH above 7; alkalinity is the capacity to neutralise acid, and the two should not be confused1. To predict an acid dose both must be known, and it is the alkalinity that sets how much acid a change of pH will take1.
The carbonate system
Carbon dioxide dissolves in water, and a small part of it combines with water to form carbonic acid (H₂CO₃); there is about 630 times more dissolved carbon dioxide than carbonic acid2. Carbonic acid gives up a hydrogen ion to become bicarbonate, and bicarbonate can give up a second to become carbonate2,3. Wedemeyer writes the chain as one reversible equilibrium:
CO₂ (gas) ⇌ CO₂ (dissolved) + H₂O ⇌ H₂CO₃ ⇌ H⁺ + HCO₃⁻ ⇌ 2H⁺ + CO₃²⁻2
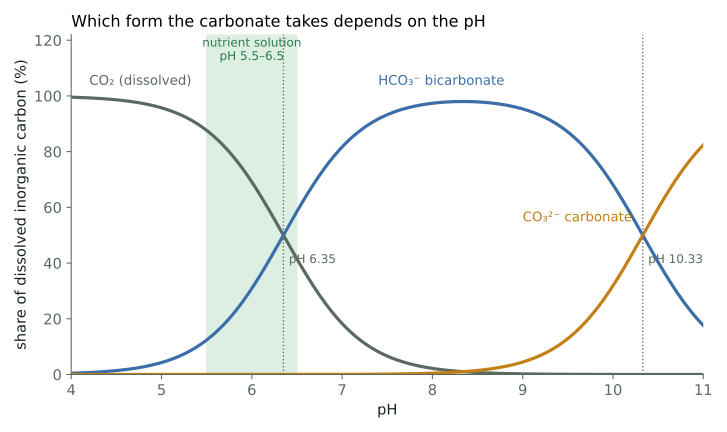
Each step has a pH at which its two neighbours are present in equal amounts. Boyd gives the first constant as 10⁻⁶·³⁵, so carbon dioxide and bicarbonate are equal at pH 6.35, and the second as 10⁻¹⁰·³³, so bicarbonate and carbonate are equal at pH 10.333. Wedemeyer prints the same two constants as pK values of 6.37 and 10.252. Between pH 4.5 and 8.3 a water holds carbon dioxide and bicarbonate, and the proportion of the two sets the pH; at 8.3 and above there is no free carbon dioxide left and bicarbonate is in equilibrium with carbonate instead3. Little carbonate is present unless the pH is above 102. A nutrient solution at pH 5.5 to 6.5 sits on either side of 6.35, where carbon dioxide and bicarbonate are present in comparable amounts3.
The bicarbonate itself comes from rock. Rain holds dissolved carbon dioxide and is slightly acid, about pH 5.7, but carbon dioxide reacting with pure water produces no measurable bicarbonate; the bicarbonate in a water comes from the reaction of that carbon dioxide with minerals as the water passes through soil and rock3. Limestone dissolves as calcium carbonate plus carbon dioxide plus water, giving one calcium ion and two bicarbonate ions3. Hard and alkaline water therefore usually arrive together, but hardness counts the calcium and magnesium, alkalinity the bicarbonate and carbonate, and the two are independent2. In regions with acid soils natural water seldom has more than 50 mg/L of alkalinity as calcium carbonate; where soils contain limestone 50 to 200 mg/L is usual; groundwater from limestone formations may reach 500 mg/L3.
Why the pH of a running system climbs
Three mechanisms push the pH of a nutrient solution upwards, and bicarbonate is involved in two of them.
The acid you add turns bicarbonate into carbon dioxide, and the carbon dioxide leaves. When hydrogen ions are added to water at pH 7.5 they react with bicarbonate to make more carbon dioxide, and the pH changes little as long as bicarbonate remains3. The carbon dioxide produced does not stay. The bicarbonate buffer is an open system: carbon dioxide can leave the water freely, and an aerated or stirred tank strips it into the air2. Stripping carbon dioxide shifts the equilibrium and moves the pH to a higher value2; in Resh’s words, the carbonate or bicarbonate found in most waters causes the pH to rise or stay high4.
The size of the effect follows from the buffer equation Wedemeyer gives for the first carbonate step, pH = 6.37 + log([HCO₃⁻]/[H₂CO₃]): the pH depends on the ratio of bicarbonate to dissolved carbon dioxide, not on the amount of either2. Dose a water so that 1 mmol/L of bicarbonate remains next to 2 mmol/L of fresh carbon dioxide and, with Boyd’s constant, the meter reads 6.35 + log(1/2) = 6.05; let the carbon dioxide fall to a tenth of that as it escapes and the same water reads 6.35 + log(1/0.2) = 7.053. Nothing was added; the gas left.
Roots feeding on nitrate remove hydrogen ions. Nutrient uptake is coupled to proton transport across the root membrane; when a plant takes up more anions than cations, as it does when most of its nitrogen arrives as nitrate, the net effect is removal of hydrogen ions from the solution and a rise in pH6. pH covers this mechanism and the nitrate-to-ammonium ratio that controls it.
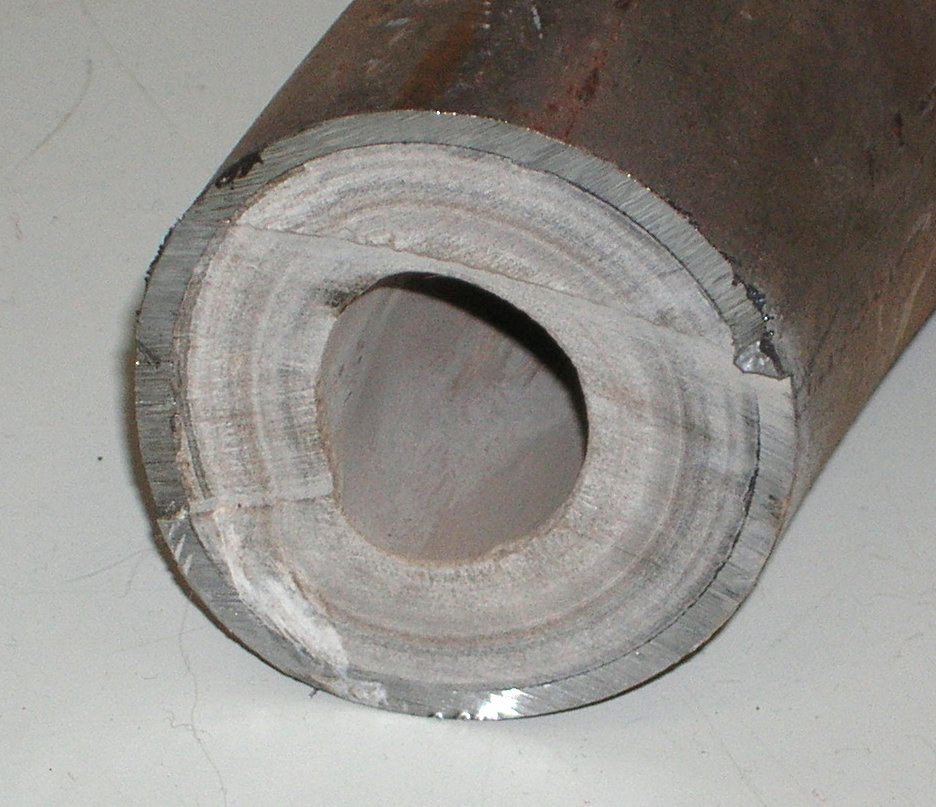
Every top-up brings the raw water’s bicarbonate back. The FAO aquaponics manual describes the result in a recirculating system: the resupply water brings the buffering agents, the carbonates, back, and the system’s own acid production is then not enough to react with them and lower the pH10. In an aquaponic unit that acid comes from nitrification; a nitrate-fed hydroponic solution has no such acid source, so nothing counters the bicarbonate the top-up brings. This is Bailey’s reason for acidifying irrigation water before use: reducing the bicarbonate and carbonate prevents a rise in substrate pH over time1.
The units on a water report
Laboratories report alkalinity as milligrams per litre of calcium carbonate equivalent (mg/L CaCO₃), as milliequivalents per litre (meq/L), or as bicarbonate in mg/L1,5. In the formal definition each carbonate ion counts twice, because it can absorb two hydrogen ions, and each bicarbonate once2.
The conversion factor comes from molar masses, taken here from Resh’s table of atomic weights: calcium 40.08, carbon 12.01, oxygen 16.00, hydrogen 1.0084. Calcium carbonate, CaCO₃, has a molar mass of 40.08 + 12.01 + 3 × 16.00 = 100.09 g/mol4. One mole of it neutralises two moles of hydrogen ions, so one equivalent is half a mole, 50.04 g, and 1 meq/L of alkalinity is 50.04 mg/L as CaCO₃1,4. Bicarbonate, HCO₃⁻, has a molar mass of 1.008 + 12.01 + 3 × 16.00 = 61.02 g/mol and carries one charge, so 1 meq/L is 1 mmol/L is 61.02 mg/L of bicarbonate4.
| Report says | Convert by | meq/L | mmol/L HCO₃⁻ (if all bicarbonate) |
|---|---|---|---|
| 50.04 mg/L as CaCO₃ | ÷ 50.041,4 | 1.0 | 1.0 |
| 61.02 mg/L HCO₃⁻ | ÷ 61.024 | 1.0 | 1.0 |
| 150 mg/L as CaCO₃ | ÷ 50.04 | 3.05 | 3.0 |
| 122 mg/L HCO₃⁻ | ÷ 61.02 | 2.05 | 2.0 |
The last column assumes that the whole alkalinity is bicarbonate, which is true of most waters below pH 8.33. A test kit can confirm it: the phenolphthalein alkalinity, titrated to pH 8.3, counts only hydroxide and carbonate, and if it is near zero the total alkalinity is nearly all bicarbonate2. Alkalinity does not change when carbon dioxide is added or removed2, so a sample that degasses on its way to the laboratory still gives the right value.
What each acid does, and what it adds
A strong acid removes alkalinity by handing its hydrogen ions to bicarbonate, which becomes carbonic acid and then carbon dioxide and water2,3. The anion of the acid stays behind, and it is a nutrient. Every mineral acid is also a fertiliser, which is why Jones warns that nitric acid adds nitrate and phosphoric acid adds phosphorus, and prefers sulfuric or hydrochloric acid because their ions have the least effect on the recipe5. Jones’s hard-water NFT stock solutions use 67% nitric acid and 85% phosphoric acid, the latter as the only phosphorus source5.
| Acid | Reaction with bicarbonate | H⁺ per molecule | Nutrient added per meq of alkalinity removed |
|---|---|---|---|
| Nitric, HNO₃ | HNO₃ + HCO₃⁻ → NO₃⁻ + H₂O + CO₂ | 1 | 14.01 mg/L of nitrate-N4 |
| Phosphoric, H₃PO₄ | H₃PO₄ + HCO₃⁻ → H₂PO₄⁻ + H₂O + CO₂ | essentially 1 at nutrient-solution pH7 | 30.97 mg/L of P4 |
| Sulfuric, H₂SO₄ | H₂SO₄ + 2HCO₃⁻ → SO₄²⁻ + 2H₂O + 2CO₂ | 2 | 32.06 ÷ 2 = 16.03 mg/L of S4 |
| Citric, C₆H₈O₇14 | three carboxyl groups13, partly dissociated | up to 3 | organic carbon, no mineral nutrient |
Phosphoric acid has three hydrogen atoms, but at the pH of a nutrient solution essentially only the first is given up: at pH 5 all the phosphate is present as H₂PO₄⁻, and the conversion to HPO₄²⁻ happens around pH 7.3, the second dissociation constant7. For dosing, one molecule of phosphoric acid neutralises one equivalent of alkalinity and leaves one dihydrogen phosphate ion, 30.97 mg of phosphorus per millimole4,7. Sulfuric acid gives up both hydrogens, so one millimole neutralises two equivalents and adds 16.03 mg of sulfur per equivalent4. Citric acid is a weak organic acid with three carboxyl groups13; it adds no mineral nutrient, only carbon, and because a weak acid does not release all its hydrogen at a given pH its dose cannot be read off the table as simply.
These figures decide the choice of acid. For a water with 6.0 meq/L of alkalinity, Bailey calculates that phosphoric acid supplies 126 mg/L of phosphorus at every irrigation, a high level and a reason it may not be feasible for very alkaline water, while 67% nitric acid supplies 67 mg/L of nitrogen and sulfuric acid 75 mg/L of sulfur; the fertiliser programme must be adjusted for the nutrient the acid supplies1. Handling and safety are in pH.
Worked example: how much acid, and what it adds
Take a well water with an alkalinity of 150 mg/L as CaCO₃, the upper limit of Whipker’s guideline, whose desired level is 40 to 65 mg/L5. We do not remove all of it, for reasons given in the next section, but leave 40 to 65 mg/L, Whipker’s desired range, and take 50 mg/L as the target residual4,5. The acid must neutralise 150 − 50 = 100 mg/L as CaCO₃, which at 50.04 mg per milliequivalent is 2.0 meq/L, or 1.7 to 2.2 meq/L for residuals of 65 and 40 mg/L1,4. A 1,000 L tank therefore needs 2.0 mol of hydrogen ions1,4.
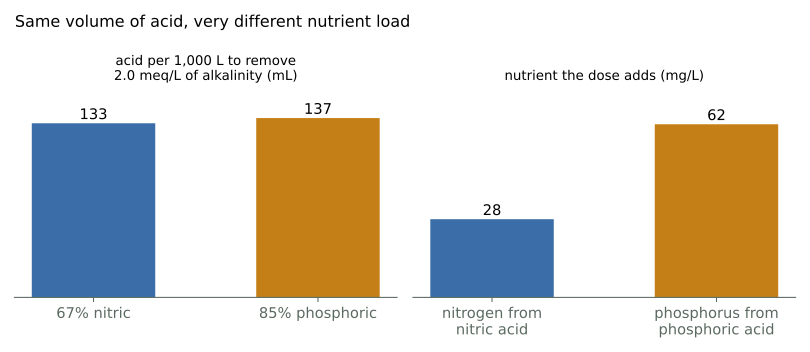
Nitric acid, 67% by mass. Jones’s 67% grade5 is close to the constant-boiling composition of 68%, for which the Merck Index gives a density of 1.41 g/mL at 20 °C8. Taking that density as a close approximation for the 67% acid, one millilitre holds about 1.41 × 0.67 = 0.945 g of HNO₃8. The molar mass of HNO₃ is 1.008 + 14.01 + 3 × 16.00 = 63.02 g/mol4, so each millilitre holds 0.945 ÷ 63.02 = 0.0150 mol, 15.0 mmol4,8. For 2.0 mol the tank needs 2,000 ÷ 15.0 = 133 mL of 67% nitric acid per 1,000 L4,8. Each millimole leaves one nitrate ion, so the dose adds 2.0 mmol/L × 14.01 mg/mmol = 28 mg/L of nitrate-nitrogen4.
Phosphoric acid, 85% by mass. The Merck Index gives the density of the 85% solution as 1.685 g/mL at 25 °C9. One millilitre holds 1.685 × 0.85 = 1.432 g of H₃PO₄9; the molar mass is 3 × 1.008 + 30.97 + 4 × 16.00 = 97.99 g/mol4, so each millilitre holds 1.432 ÷ 97.99 = 0.0146 mol, 14.6 mmol4,9. One molecule gives one usable hydrogen ion at this pH7, so the tank needs 2,000 ÷ 14.6 = 137 mL of 85% phosphoric acid per 1,000 L4,7,9. The dose adds 2.0 mmol/L × 30.97 mg/mmol = 62 mg/L of phosphorus4.
The two volumes are almost the same; the difference is what they leave behind. The nitric dose adds 28 mg/L of nitrogen, which a recipe absorbs easily4. The phosphoric dose adds 62 mg/L of phosphorus, the entire phosphorus content of a full-strength modified Hoagland solution, 62 ppm13, so the phosphate salt would have to leave the recipe altogether; this is the arithmetic behind Bailey’s warning1.
A check against the extension table. Bailey’s table gives starting amounts of acid to bring the water to approximately pH 5.81. From his nutrient figures, 67 mg/L of nitrogen for 6.0 meq/L is 11.2 mg/L per meq/L, or 0.80 mmol of nitric acid per equivalent, not 1.01,4. The difference is the equilibrium: if the carbon dioxide formed by the acid is still in solution when the pH is read, the ratio of bicarbonate to carbon dioxide at pH 5.8 is 10^(5.8 − 6.35) = 0.283, so about 22% of the original bicarbonate remains and only 78% of the alkalinity has been consumed, close to the 0.80 mmol per equivalent derived from Bailey’s figures1,3. The calculation above removes a chosen number of equivalents; Bailey’s reaches a chosen pH and leaves whatever residual the equilibrium dictates.
Buffering: why you keep some alkalinity
A buffer is a mixture of a weak acid and its conjugate base that prevents the pH changes that would otherwise occur2. In water the pair is carbon dioxide and bicarbonate: add acid and it reacts with bicarbonate to form carbon dioxide; add base and it reacts with hydrogen ions, which more carbon dioxide replaces, so the pH does not rise sharply as long as carbon dioxide is present3. Buffering is strongest where the two members of the pair are equal, at the pK of 6.372.
Remove all the bicarbonate and nothing is left to absorb the next dose. Rainwater and reverse-osmosis water are the limiting case: the FAO manual states that deionised water from reverse osmosis, like rainwater, has low hardness and should be buffered, and it calls rainwater KH-free, free of carbonate hardness, its term for alkalinity10. In such a water a single drop of acid or base moves the reading at once, which is why the dose calculation above leaves a residual. Resh passes on Smith’s advice to keep carbonate plus bicarbonate at about 30 to 50 mg/L, enough to prevent sudden fluctuations in pH, adding potassium carbonate or bicarbonate to very pure water to reach it4. Whipker’s guideline sets 40 to 65 mg/L as calcium carbonate, 0.8 to 1.3 meq/L, as the desired range and 150 mg/L, 3 meq/L, as the upper limit5.
What reverse osmosis and acid injection each do to alkalinity
Reverse osmosis rejects dissolved ions at a membrane. The Nebraska extension guide lists calcium, magnesium, sodium, chloride, sulfate, nitrate, iron and potassium among the ions a household unit removes11. The product water has little alkalinity and little hardness, so the grower exchanges a pH problem for a buffering problem, solved by adding back the 30 to 50 mg/L of carbonate plus bicarbonate that Resh recommends4,10.
Acid injection leaves the other ions in place and destroys the alkalinity chemically: each equivalent of acid turns one equivalent of bicarbonate into carbon dioxide, which leaves the water2,3. Jones calls acidifying the water to remove bicarbonates and carbonates the simple, inexpensive end of water treatment and complete ion removal by reverse osmosis the expensive end12. Acid injection adds the acid’s anion; reverse osmosis adds nothing but takes the calcium and magnesium too, so the recipe must then supply all of both.
Key numbers
| Quantity | Typical value or range | Conditions | Source |
|---|---|---|---|
| Alkalinity unit conversion | 1 meq/L = 50.04 mg/L as CaCO₃ = 61.02 mg/L HCO₃⁻ = 1 mmol/L HCO₃⁻ | all alkalinity as bicarbonate | 1,2,4 |
| Carbonate dissociation constants | pK₁ 6.35, pK₂ 10.33 (Boyd); 6.37, 10.25 (Wedemeyer) | fresh water | 2,3 |
| Species present | CO₂ and HCO₃⁻ between pH 4.5 and 8.3; no CO₂ at 8.3 and above | natural water | 3 |
| Dissolved CO₂ to carbonic acid | about 630 to 1 | water | 2 |
| Natural alkalinity | seldom above 50 mg/L (acid soils); 50 to 200 mg/L (limestone soils); up to 500 mg/L (limestone groundwater) | as CaCO₃ | 3 |
| Desired alkalinity, irrigation water | 40 to 65 mg/L as CaCO₃ (0.8 to 1.3 meq/L); upper limit 150 mg/L (3 meq/L) | Whipker et al. | 5 |
| Buffering to keep | 30 to 50 mg/L carbonate plus bicarbonate | Smith, cited by Resh | 4 |
| 67% nitric acid | 15.0 mmol per mL; adds 14.01 mg/L N per meq/L removed | density 1.41 g/mL (the 68% azeotrope value, taken as an approximation) | 4,8 |
| 85% phosphoric acid | 14.6 mmol per mL; adds 30.97 mg/L P per meq/L removed | density 1.685 g/mL, one proton | 4,7,9 |
| Worked example | 150 mg/L to 50 mg/L residual: 133 mL nitric (28 mg/L N) or 137 mL phosphoric (62 mg/L P) per 1,000 L | 2.0 meq/L removed | 1,4,7,8,9 |
| Modified Hoagland phosphorus | 62 ppm | full strength | 13 |
| Bailey’s nutrient figures | 126 mg/L P, 67 mg/L N, 75 mg/L S for 6.0 meq/L to pH 5.8 | phosphoric, 67% nitric, sulfuric | 1 |
| Alkalinity left at pH 5.8 | about 22% of the original | pK₁ 6.35; carbon dioxide formed not yet degassed | 3 |
Common mistakes
- Dosing acid from the pH reading. The pH is a ratio of bicarbonate to carbon dioxide and says nothing about the amount of bicarbonate; a water a full pH unit lower can need four times the acid1,2.
- Reading the pH straight after dosing and adding more. The carbon dioxide formed by the acid has not yet escaped, so the reading is temporarily low; it rises by one unit for every tenfold fall in dissolved carbon dioxide2,3.
- Neutralising all the alkalinity. With no bicarbonate left there is no buffer and every small dose moves the pH at once; keep 30 to 65 mg/L4,5.
- Forgetting the nutrient in the acid. Each millimole of nitric acid adds 14.01 mg of nitrogen and each of phosphoric acid 30.97 mg of phosphorus; removing 2 meq/L with phosphoric acid adds 62 mg/L of phosphorus, a full Hoagland dose4,13.
- Treating hardness and alkalinity as the same line on the report. Hardness is calcium and magnesium, alkalinity is bicarbonate and carbonate; they arrive together from limestone but are independent, and the acid dose follows the alkalinity2,3.
Summary
Alkalinity is the amount of acid a water can absorb, carried almost entirely by bicarbonate and carbonate, and it is independent of the pH reading, which only states the ratio of bicarbonate to dissolved carbon dioxide at that moment1,2,3. Acid converts bicarbonate to carbon dioxide; the gas escapes, and its loss is one reason the pH of a running system climbs, alongside nitrate uptake and the bicarbonate in every top-up1,2,3,6,10. The units convert through molar mass: 50.04 mg/L as calcium carbonate, 61.02 mg/L of bicarbonate and 1 meq/L are the same quantity1,4. Each mineral acid leaves its anion as a nutrient, 14.01 mg of nitrogen or 30.97 mg of phosphorus per millimole, which the recipe must count4,5,7. For a 150 mg/L water brought down to 50 mg/L, a 1,000 L tank needs about 133 mL of 67% nitric acid or 137 mL of 85% phosphoric acid4,8,9. Some alkalinity, 30 to 65 mg/L, is kept on purpose as a buffer4,5.
Next in the series: EC and concentration.
References
- Bailey, D. A. (1994). Water acidification. North Carolina Flower Growers' Bulletin, 39(3), June 1994. North Carolina State University, Department of Horticultural Science. https://hortscans.ces.ncsu.edu/uploads/w/a/water_ac_53e4f43e11d8a.pdf
- Stickney, R. R. (ed.) (2000). Encyclopedia of Aquaculture. John Wiley & Sons, New York. Entries "Alkalinity" (G. A. Wedemeyer, pp. 25–26), "Buffer systems" (G. A. Wedemeyer, pp. 136–137) and "Carbon dioxide" (p. 145).
- Boyd, C. E. (2012). Water quality. In: Lucas, J. S. and Southgate, P. C. (eds), Aquaculture: Farming Aquatic Animals and Plants, 2nd ed. Wiley-Blackwell, Chichester. Sections 3.2.10 and 3.2.11.
- Resh, H. M. (2013). Hydroponic Food Production: A Definitive Guidebook for the Advanced Home Gardener and the Commercial Hydroponic Grower, 7th ed. CRC Press, Boca Raton. Table 3.5 and section 4.2.
- Jones, J. B. Jr. (2005). Hydroponics: A Practical Guide for the Soilless Grower, 2nd ed. CRC Press, Boca Raton. Table 7.6 (reproducing Whipker, Dole, Cavins & Gibson 2003), Chapter 7 on pH control, Table 9.8.
- Neumann, G. and Römheld, V. (2012). Rhizosphere chemistry in relation to plant nutrition. In: Marschner, P. (ed.), Marschner's Mineral Nutrition of Higher Plants, 3rd ed. Academic Press, London, pp. 347–368. https://doi.org/10.1016/B978-0-12-384905-2.00014-5
- Trejo-Téllez, L. I. and Gómez-Merino, F. C. (2012). Nutrient solutions for hydroponic systems. In: Asao, T. (ed.), Hydroponics: A Standard Methodology for Plant Biological Researches. InTech, Rijeka, pp. 1–22. Book DOI https://doi.org/10.5772/2215
- National Center for Biotechnology Information (2026). PubChem Compound Summary for CID 944, Nitric acid. Section "Other Experimental Properties", quoting O'Neil, M. J. (ed.) (2006), The Merck Index, 14th ed., p. 1138, via the Hazardous Substances Data Bank. https://pubchem.ncbi.nlm.nih.gov/compound/944 (machine-readable: https://pubchem.ncbi.nlm.nih.gov/rest/pug_view/data/compound/944/JSON?heading=Other+Experimental+Properties
- National Center for Biotechnology Information (2026). PubChem Compound Summary for CID 1004, Phosphoric acid. Section "Density", quoting the Merck Index via the Hazardous Substances Data Bank. https://pubchem.ncbi.nlm.nih.gov/compound/1004 (machine-readable: https://pubchem.ncbi.nlm.nih.gov/rest/pug_view/data/compound/1004/JSON?heading=Density
- Somerville, C., Cohen, M., Pantanella, E., Stankus, A. and Lovatelli, A. (2014). Small-scale aquaponic food production: integrated fish and plant farming. FAO Fisheries and Aquaculture Technical Paper No. 589. FAO, Rome. Sections 3.4.4 and 3.5, Appendix 2.
- Dvorak, B. I. and Skipton, S. O. Drinking Water Treatment: Reverse Osmosis. University of Nebraska–Lincoln Extension, NebGuide G1490. https://extensionpubs.unl.edu/publication/g1490/na/html/view
- Jones, J. B. Jr. (2014). Complete Guide for Growing Plants Hydroponically. CRC Press, Boca Raton.
- Taiz, L. and Zeiger, E. (2002). Plant Physiology, 3rd ed. Sinauer Associates, Sunderland, MA. Chapter 5, Mineral Nutrition (modified Hoagland solution) and Chapter 11, Respiration and lipid metabolism.
- Scarfe, A. D., Lee, C.-S. and O'Bryen, P. J. (eds) (2006). Aquaculture Biosecurity: Prevention, Control, and Eradication of Aquatic Animal Disease. Blackwell Publishing, Ames, IA.
This article was drafted with the help of AI tools and reviewed and edited by PonicLabs. Sources are listed above; tell us if you find an error.