EC and concentration: what the meter measures
Contents
Standfirst: After reading this article you will be able to read an EC meter in any of the units it may show, convert a reading between mS/cm, dS/m, µS/cm, CF and the ppm scales, correct a reading taken at the wrong temperature, estimate the EC of a simple recipe from its ion concentrations, and say what an EC reading can and cannot tell you about a nutrient solution.
Before you read: What plants are made of: the essential elements, Water quality.
Dissolved ions carry the current
A nutrient solution is water with fertiliser salts dissolved in it. When a salt dissolves, it separates into ions, electrically charged atoms or groups of atoms; calcium nitrate, for example, gives calcium ions with two positive charges and nitrate ions with one negative charge (What plants are made of). Ions can move, and a moving charge is an electric current. If two electrodes are placed in the solution and a voltage is applied between them, the ions drift towards the electrodes and current flows. The more ions there are in a given volume, the more current flows. Resh puts the consequence in one sentence: as the total salt level increases, the solution “will more readily conduct an electric current”1.
That is all an EC meter does. It measures how well the solution conducts, and conduction rises with the total concentration of dissolved ions. On the conductivity-factor scale, zero is defined as pure water containing no nutrient3. The laboratory instrument in the 1954 United States Salinity Laboratory handbook is a cell with two platinised electrodes a fixed distance apart, fed with alternating current, whose reading is multiplied by a “cell constant”, 0.5 per centimetre for their cell, to give the conductivity of the liquid4. A pocket meter is the same thing made small.
The units on the display
Conductance is the reciprocal of resistance. Its SI unit is the siemens, symbol S, which the International Bureau of Weights and Measures lists among the derived units with special names; the name was adopted in 1971 for the unit formerly called the reciprocal ohm5. Older books use the mho, which is “ohm” spelled backwards, and one mho is one siemens1. Conductivity is the conductance of a standard volume of solution, a one-centimetre cube between two plates, so its unit is siemens per centimetre; nutrient solutions are measured in millisiemens per centimetre.
Three spellings of the same unit are in use, and they are equal: 1 dS/m = 1 mS/cm = 1,000 µS/cm = 1 mmho/cm2. Some meters show CF, the conductivity factor, a scale on which 10 CF equals 1 dS/m2,3. All of these are physical measurements of the solution; the ppm and TDS scales are not, as a later section explains.
| Unit | Equals | Where you meet it |
|---|---|---|
| mS/cm (millisiemens per centimetre) | 1 mS/cm | most hydroponic meters and books1,2 |
| dS/m (decisiemens per metre) | 1 mS/cm | soil science, irrigation and laboratory reports2,4 |
| µS/cm (microsiemens per centimetre) | 0.001 mS/cm | raw-water reports, low-conductivity water2 |
| mmho/cm (millimho per centimetre) | 1 mS/cm | older hydroponic texts1,2 |
| CF (conductivity factor) | 10 CF = 1 mS/cm | some meters and texts2,3 |
The thousandfold difference between µS/cm and mS/cm is the most common unit error in print. Jones’s table of water-quality guidelines gives a target of “1.0 to 1.5 µS/cm” where the footnote to the same table says EC is measured in millisiemens; read as printed, the target would be one thousand times too low2. When a figure looks wrong by a factor of a thousand, check the prefix before checking the solution.
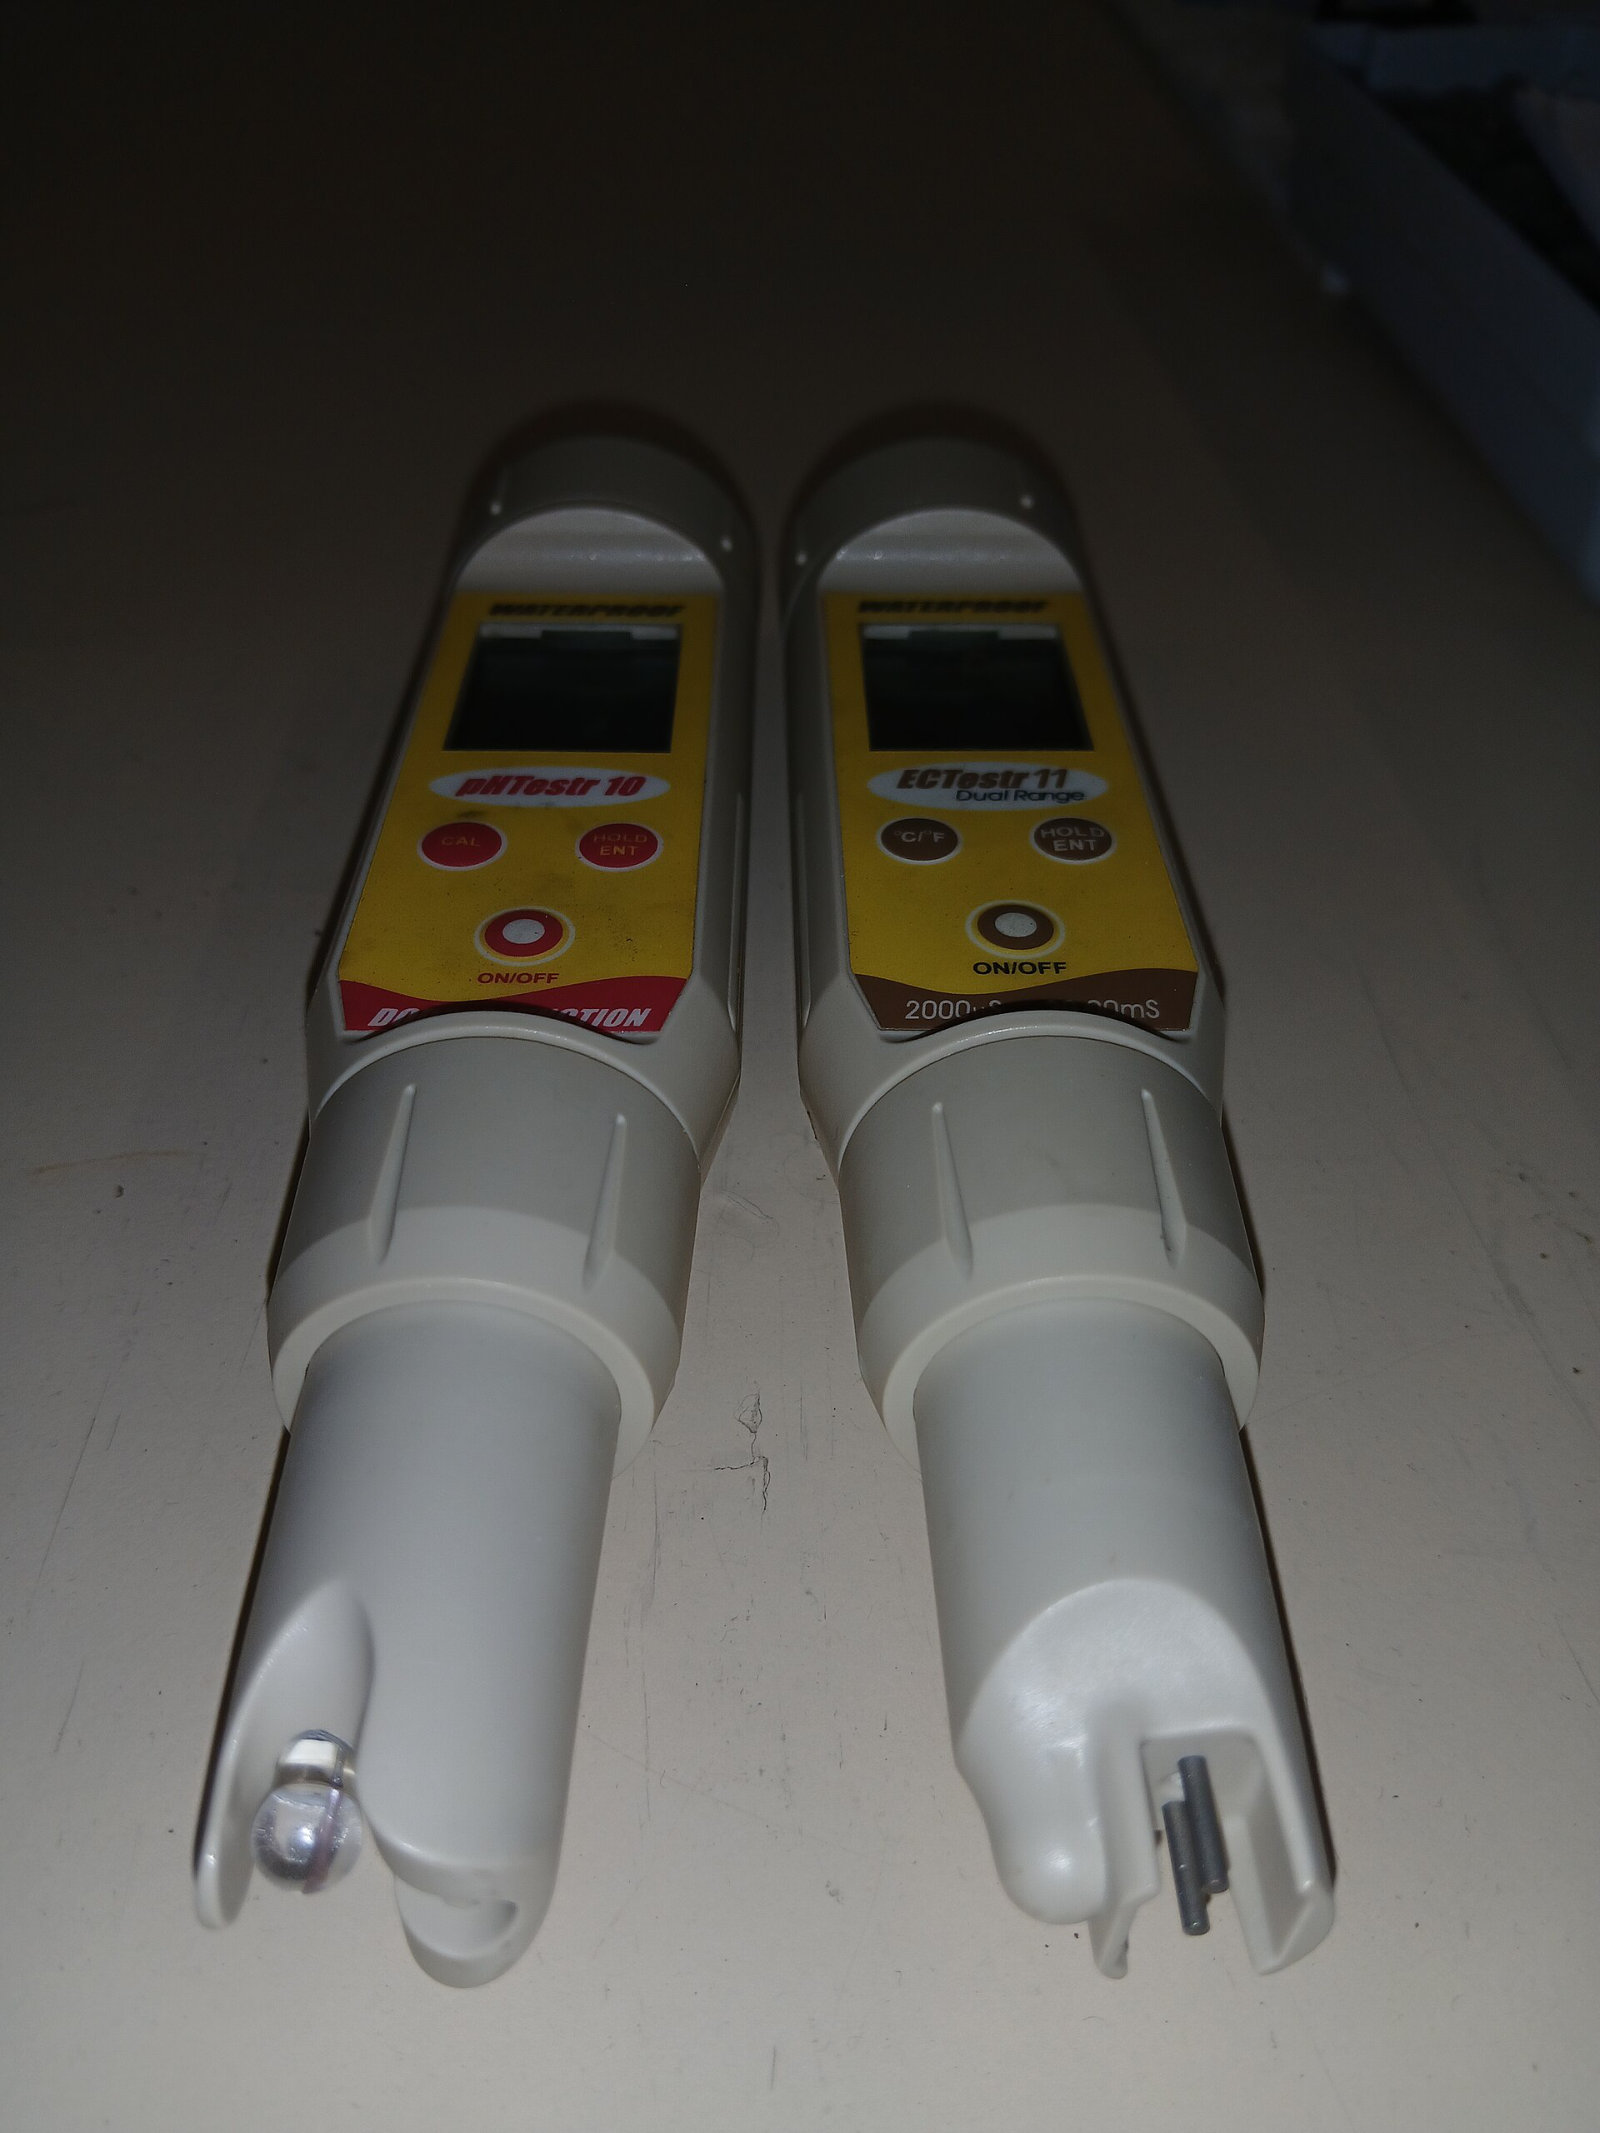
Temperature changes the reading, so meters correct to 25 °C
Ions move faster in warm water. Mason states the consequence: if the temperature of a solution is raised, “the EC will increase, even though there are no extra nutrients added”3. The same solution therefore reads higher on a hot afternoon than on a cold morning without any change in its salts. By convention, conductivity is reported at 25 °C1,8.
The size of the effect is tabulated. Resh reproduces the Salinity Laboratory’s factors for converting a reading at any temperature to its value at 25 °C: multiply by 1.247 at 15 °C, 1.112 at 20 °C, 1.000 at 25 °C, 0.907 at 30 °C and 0.829 at 35 °C1,4. Between 20 °C and 25 °C that is a change of 11.2% over five degrees, about 2.2% per degree, and between 25 °C and 30 °C about 2.0% per degree1,4. Hanna gives the same order for the linear coefficient that meters apply to neutral salts, “typically between 1.5 to 2.2%/°C”7. A 5 °C error in temperature is therefore a 10% error in EC1,4,7.
Most meters do this correction for you; Resh notes that many have built-in temperature compensation that “automatically makes the necessary adjustment”1. It still matters with a meter that has no temperature sensor, and with a conversion factor quoted at another reference temperature, such as the 700 ppm per mS/cm that Mason cites “at 20°C”3.
A worked example. Suppose a meter without compensation reads 1.60 mS/cm in a tank at 20 °C; the value at 25 °C is 1.60 × 1.112 = 1.78 mS/cm1,4. Compare the corrected value with a crop target, not the raw reading. The same tank read at 30 °C would show about 1.78 ÷ 0.907 = 1.96 mS/cm with no change in its salts1,4.
What EC cannot tell you
EC counts ions by their effect on conduction, not by name. Resh states the limit plainly: “EC measures total solutes; it does not differentiate among the various elements”1. Two consequences follow.
First, different salts conduct differently at the same mass concentration. Resh writes that ammonium sulfate conducts about twice as much as calcium nitrate and about three times as much as magnesium sulfate (his own table, below, gives 1.7 and 2.8 times), while urea, which does not form ions in water, “does not conduct electricity at all”1. His table of 0.2% solutions, two grams of salt in one litre of distilled water, gives 2.0 mS/cm for calcium nitrate, 2.5 for potassium nitrate, 3.4 for ammonium sulfate and 1.2 for magnesium sulfate heptahydrate1. The Salinity Laboratory saw the same pattern in single-salt solutions: the curves for the chloride salts and sodium sulfate “almost coincide”, but magnesium sulfate, calcium sulfate and sodium bicarbonate “have lower conductivities than the other salts at equivalent concentrations”4. Resh adds that a recipe with a higher nitrogen-to-potassium ratio reads lower in EC at the same total strength, because nitrate tracks EC less closely than potassium does1.
Second, and more important for the grower, two solutions can show the same EC and feed a crop in completely different ways. Resh’s conductivity table gives 1.0 mS/cm for a solution of 490 ppm of sodium chloride, and his calcium-nitrate table gives 1.0 mS/cm for a 0.1% solution of calcium nitrate, which is one gram per litre1. A meter cannot distinguish them. The calcium nitrate solution supplies two macronutrients. The sodium chloride solution supplies sodium, which is not an essential element, and chloride, which plants need only in traces (What plants are made of); in a recirculating system both accumulate (Water quality). The reading says nothing about which of the two you have.
The same blindness applies inside a working solution. A crop takes up elements at different rates, so after some weeks the EC can be back at its target while one element is short and another has piled up; Jones observes that replenishing by EC “does not take into account individual losses of elements” through root uptake2. EC is a measure of strength, never of balance; balance needs a laboratory analysis or a fresh solution (Managing a recirculating solution over time).
“ppm” and TDS meters are EC meters with a multiplier
Many pocket meters display parts per million, and some call the figure TDS, total dissolved solids. Resh is direct about what they are: TDS instruments “are basically water conductivity measuring instruments”1. The meter measures EC and multiplies by a fixed number. The number depends on the salt the manufacturer chose to define the scale, and manufacturers chose differently.
Bluelab’s support page states the two scales its meters offer: “ppm500 = EC x 500” and “ppm700 = EC x 700”, the 500 scale being “based on measuring the NaCl or sodium chloride content of a solution” and the 700 scale on potassium chloride6. Jones gives a third factor, “EC (in dS/m) x 640 = TDS”, with the note that it is approximate and “depends on type of salt”2. Resh uses a rule of thumb of about 650 ppm per mS/cm, and his own table gives 666 ppm at 1.0 mS/cm1. Mason quotes 700 ppm per mS/cm at 20 °C3.
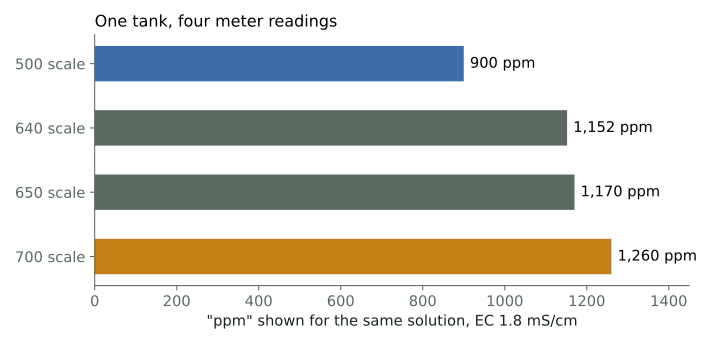
A worked example. Take a reading of 1.8 mS/cm at 25 °C and apply each factor1,2,3,6:
- 500 scale: 1.8 × 500 = 900 ppm6
- 640 scale: 1.8 × 640 = 1,152 ppm2
- 650 scale: 1.8 × 650 = 1,170 ppm1
- 700 scale: 1.8 × 700 = 1,260 ppm3,6
Four meters in the same tank would show 900 to 1,260 ppm, a spread of 40%, and none of them wrong by its own definition1,2,3,6. None of the figures is the mass of salts in the water either; Bluelab’s page says so for its own products: “The true ppm of a solution can only be determined by a chemical analysis, ppm cannot be measured by an EC meter”6. A recipe that gives a ppm target without naming the scale cannot be followed.
For these reasons this series reports solution strength as EC in mS/cm, and we recommend you do the same. If a chart you rely on is in ppm, find out which scale its author used and divide by that factor to recover the EC.
EC and the sum of ion charges
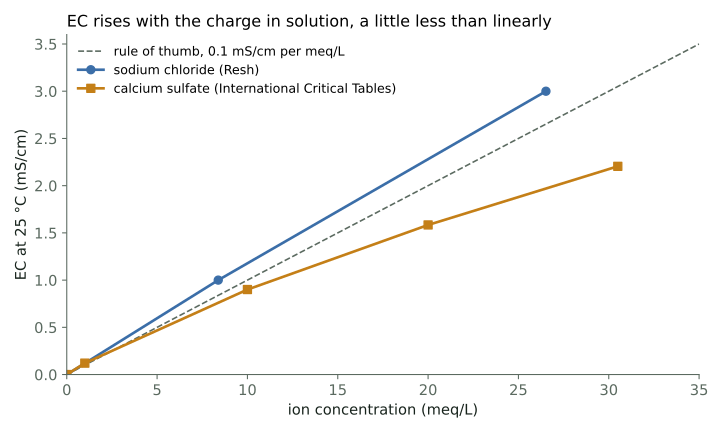
Chemists count ions by charge, in milliequivalents per litre (meq/L): the concentration in millimoles per litre multiplied by the charge on the ion (Water quality shows the conversion from mg/L). The Salinity Laboratory plotted conductivity against meq/L for single salts because, counted this way, most salts fall close to one line, whereas “when the concentration is given in percent salt or parts per million, the curves are more widely separated”4. This is the basis of a useful estimate: at nutrient-solution strength, each milliequivalent per litre of cations adds roughly one tenth of a millisiemens per centimetre.
Two sourced tables show the rule and its limits. From Resh’s sodium chloride table, 490 ppm of NaCl reads 1.0 mS/cm and 1,550 ppm reads 3.0 mS/cm1. With the atomic weights of sodium, 22.99, and chlorine, 35.45, a mole of NaCl is 58.44 g, so those solutions hold 8.4 and 26.5 meq/L, or 0.12 and 0.11 mS/cm per meq/L1. From the International Critical Tables data reproduced in the Salinity Laboratory handbook, calcium sulfate reads 0.121 mS/cm at 1 meq/L, 0.900 at 10 meq/L, 1.584 at 20 meq/L and 2.205 at 30.5 meq/L, or 0.12, 0.09, 0.08 and 0.07 mS/cm per meq/L4. The factor is close to 0.1 for both salts at nutrient-solution strength; it falls as concentration rises, because crowded ions interfere with one another; and it is lower for calcium sulfate, a salt of two doubly charged ions, than for sodium chloride1,4. A nutrient solution mixes both kinds, so 0.08 to 0.12 mS/cm per meq/L is the honest range1,4.
A worked example, with a recipe whose measured EC is published. Jones prints Hoagland and Arnon’s solution No. 1, made from one-molar stock solutions dosed at 1.0 mL/L of potassium dihydrogen phosphate, 5.0 mL/L of potassium nitrate, 5.0 mL/L of calcium nitrate and 2.0 mL/L of magnesium sulfate, and states that it “has an EC of 2.7 dS/m”2. One millilitre of a one-molar stock in one litre gives one millimole per litre, so the cations are:
- calcium: 5 mmol/L × 2 charges = 10 meq/L2
- potassium: (5 + 1) mmol/L × 1 charge = 6 meq/L2
- magnesium: 2 mmol/L × 2 charges = 4 meq/L2
- total cation charge: 20 meq/L2
At 0.08 to 0.12 mS/cm per meq/L the estimate is 1.6 to 2.4 mS/cm, against the 2.7 dS/m that Jones reports1,2,4. The estimate lands within about 10% to 40% of the printed value, which is what the rule is good for: a check that a recipe is roughly the strength you intended, or that a meter is not reading nonsense2. It is not a substitute for measuring. As a cross-check, Jones’s element concentrations for the same solution, 232 mg/L of potassium, 224 mg/L of calcium and 49 mg/L of magnesium, divided by the atomic weights 39.10, 40.08 and 24.31 and multiplied by the charges, give 5.9 + 11.2 + 4.0 = 21 meq/L1,2.
Crop EC targets and what they depend on
Every target below comes from Resh’s recommendations for specific systems and stages, and the conditions matter as much as the numbers. Resh gives a general working range of 2.0 to 4.0 mS/cm, and warns that above 4 mS/cm “wilting, suppressed growth, and fruit cracking” may follow1. He also writes that 1,000 to 1,500 ppm of total elements, corresponding to 1.5 to 3.5 mS/cm, suits root uptake, with the lower end, 1.5 to 2.0, preferred for cucumbers and the upper end, 2.5 to 3.5, for tomatoes1. Jones notes that most published formulas have an EC below 3.0 dS/m when first made2.
| Crop and stage | EC, mS/cm at 25 °C | Conditions | Source |
|---|---|---|---|
| Lettuce, raft culture | 1.2 to 1.3 | commercial raft system, solution chilled to 18 to 23 °C | 1 |
| Herbs | 1.6 to 2.5 | conditions similar to lettuce; raise EC in cloudy weather | 1 |
| Cucumber | 1.5 to 2.0 | general recommendation | 1 |
| Tomato | 2.5 to 3.5 | general recommendation | 1 |
| Tomato seedlings, after emergence | 1.0 to 1.5 | dilute solution in rockwool cubes | 1 |
| Tomato, transplant blocks | 2.5 to 3.0 | solution used to soak the blocks, pH 6.0 | 1 |
| Pepper, germination | 0.5 | raw water, pH 5.8, before emergence | 1 |
| Pepper, transplant blocks | 2.0 to 2.2 | solution used to soak the blocks, pH 5.2 | 1 |
| Any crop, upper limit | above 4 | wilting, suppressed growth, fruit cracking | 1 |
Two patterns in the table come from the mechanism. Seedlings get a weaker solution than established plants, because a high ion concentration makes water harder for roots to take up (Water in the plant); Resh’s sequence for tomato goes from 1.0 to 1.5 mS/cm at emergence to 2.5 to 3.0 at transplanting1. Fruiting crops run higher than leafy ones, and within a crop the target moves with the weather, which is why Resh raises the EC for herbs in cloudy periods “to prevent succulent growth”1. Mason’s general point is that preferred levels “can vary during a crop’s life”3. Growing leafy greens and herbs and Growing fruiting crops give stage-by-stage values.
When the EC in the tank drifts
In a recirculating tank the reading moves for two opposite reasons. When plants transpire quickly, “as happens on hot, low-humidity days”, water leaves the tank faster than ions do, and if it is not replaced the EC rises2. When plants take up nutrients faster than water, the EC drops; Mason’s rule is that when a drop is detected, nutrients are added to bring it back to the desired level3. A rising EC therefore usually means “add water” and a falling EC “add nutrients”, but the reading cannot say which ions were taken, and topping up to the target EC for weeks can leave the solution unbalanced2. Managing a recirculating solution over time builds the mass balance behind this.
Key numbers
| Quantity | Typical value or range | Conditions | Source |
|---|---|---|---|
| Unit equivalence | 1 dS/m = 1 mS/cm = 1,000 µS/cm = 1 mmho/cm | by definition | 2 |
| CF scale | 10 CF = 1 mS/cm | meters that show CF | 2,3 |
| Reference temperature | 25 °C | convention for reporting EC | 1,8 |
| Temperature factor to 25 °C | 1.247 at 15 °C; 1.112 at 20 °C; 0.907 at 30 °C; 0.829 at 35 °C | multiply the reading | 1,4 |
| Temperature coefficient | about 2% per °C (1.5 to 2.2) | neutral salts, linear compensation | 7, derived from1,4 |
| ppm conversion factors | 500, 640, 650, 700 ppm per mS/cm | by meter brand and scale | 6,2,1,3 |
| 0.2% solutions in distilled water | calcium nitrate 2.0; potassium nitrate 2.5; ammonium sulfate 3.4; magnesium sulfate 1.2 mS/cm | 2 g/L | 1 |
| 1.0 mS/cm equals | 490 ppm NaCl, or 1 g/L calcium nitrate | single-salt solutions | 1 |
| EC per unit of cation charge | 0.08 to 0.12 mS/cm per meq/L | nutrient-solution strength; lower for divalent salts and at higher concentration | derived from1,4 |
| Hoagland solution No. 1 | 20 meq/L cations; measured 2.7 dS/m | Jones’s table | 2 |
| General working range | 1.5 to 3.5 mS/cm; harm above 4 | Resh’s general recommendation | 1 |
| Crop targets | see table above | 1 |
Common mistakes
- Following a “ppm” target without knowing the scale. The same solution reads 900 ppm on a 500-scale meter and 1,260 ppm on a 700-scale meter, because both are EC multiplied by a brand-specific factor3,6.
- Reading EC as a measure of nutrient balance. EC rises with any ion, including sodium and chloride from the raw water, and it cannot say which element is short1,2.
- Comparing readings taken at different temperatures. Conductivity changes by about 2% per degree, so an uncompensated reading at 20 °C understates the 25 °C value by about 10%1,4,7.
- Treating a µS/cm figure as mS/cm, or the reverse. The two differ by a factor of one thousand, and the misprint occurs even in textbooks2.
- Expecting the sum-of-charges estimate to match the meter. It gives the right order of magnitude, within tens of percent, and the measured value is the one to record1,2,4.
Summary
An EC meter measures how well a solution conducts electricity, which rises with the total concentration of dissolved ions. The unit is the siemens, and 1 mS/cm, 1 dS/m, 1,000 µS/cm, 1 mmho/cm and 10 CF are all the same quantity2. Conductivity rises about 2% for each degree of warming, so readings are reported at 25 °C and most meters correct automatically1,4,7. EC says how much is dissolved, not what: salts conduct differently, a sodium chloride solution and a calcium nitrate solution can read the same, and a tank can be at its target EC while out of balance. Meters that show ppm multiply EC by 500, 640, 650 or 700 depending on the brand, so report EC in mS/cm instead1,2,3,6. Each milliequivalent per litre of cations adds roughly 0.1 mS/cm, which lets you check a recipe before you mix it1,4. Crop targets run from about 1 mS/cm for seedlings and lettuce to 2.5 to 3.5 mS/cm for tomato, and above 4 mS/cm plants suffer1.
Next in the series: Fertiliser salts: purity, solubility, compatibility.
References
- Resh, H. M. (2013). Hydroponic Food Production: A Definitive Guidebook for the Advanced Home Gardener and the Commercial Hydroponic Grower, 7th ed. CRC Press, Boca Raton. ISBN 978-1-4398-7869-9.
- Jones, J. B. Jr. (2005). Hydroponics: A Practical Guide for the Soilless Grower, 2nd ed. CRC Press, Boca Raton.
- Mason, J. Commercial Hydroponics, 3rd ed. ISBN 978-0-9871022-2-5 (corpus p.4).
- Richards, L. A. (ed.) (1954). Diagnosis and Improvement of Saline and Alkali Soils. United States Department of Agriculture, Agriculture Handbook No. 60. United States Salinity Laboratory, Riverside. pp. 9–10, 89–90, 99. https://www.ars.usda.gov/ARSUserFiles/20360500/hb60_pdf/hb60complete.pdf
- Bureau International des Poids et Mesures (2019). The International System of Units (SI), 9th ed. Table 4 (p. 133) and Appendix 1 (p. 167). https://www.bipm.org/documents/20126/41483022/SI-Brochure-9-EN.pdf
- Bluelab. What are the different conductivity scales? What do they mean? Bluelab support article 205237090. https://support.bluelab.com/hc/en-us/articles/205237090-What-are-the-different-conductivity-scales-What-do-they-mean-
- Hanna Instruments. EC: Why do I need temperature compensation for measuring EC? Hanna knowledge base. https://knowledge.hannainst.com/knowledge/ec-why-do-i-need-temperature-compensation-for-measuring-ec
- Castilla, N. (2013). Greenhouse Technology and Management, 2nd ed. CABI, Wallingford. Appendix 1, section A.8.2.
This article was drafted with the help of AI tools and reviewed and edited by PonicLabs. Sources are listed above; tell us if you find an error.