Managing a recirculating solution over time
Contents
Standfirst: After reading this article you will be able to explain why a recirculating solution never stays as you mixed it, read EC and pH drift as evidence of what the crop and the make-up water are doing, write a one-line mass balance for sodium, calculate how many weeks a given water takes to push sodium past a limit, and choose between topping up, bleeding and replacing on evidence rather than on the calendar.
Before you read: EC and concentration, pH, Water quality, How roots take up nutrients.
A closed tank changes through three flows
In a recirculating system, also called a closed system, the solution leaves the tank, passes the roots and comes back. Nothing drains away. Only three things can change it: the crop, the water you add to replace what the crop used, and what you dose by hand. Each is a flow of ions into or out of the tank, and managing the solution means keeping the books on those flows.
The first flow is the crop. Resh gives the cause of every change in a closed solution in one sentence: plants absorb the various elements differentially, so some run short before others, and because the plant absorbs relatively more water than salts, the concentration of what stays behind rises1. Sonneveld and van der Burg name the principal salinity problem of soilless culture: sodium and chloride are abundant in many irrigation waters but only sparingly absorbed by most crops, so they accumulate, and high concentrations are reached quickly in the small root volumes of soilless systems4.
The second flow is the make-up water. Resh explains why water quality matters more in a closed system: raw water is added to the returning solution to replace what the plants transpired, so every addition brings more ions, and if the raw water carries significant levels this eventually leads to toxicity1. Water quality shows how to read the report that says what each litre brings. The third flow is your own dosing: every fertiliser top-up and every millilitre of acid or base adds ions, and fertiliser impurities add sodium, which Sonneveld and van der Burg include as a term in their leaching calculation4.
To compare the first two flows you need one idea, Sonneveld’s uptake concentration of an ion: the amount of it the crop removed divided by the volume of water the crop absorbed5. Sonneveld and van der Burg measured it weekly as millimoles per litre of water absorbed4. Accumulation, in Signore and co-workers’ words, originates from ion-to-water inlet ratios higher than the corresponding uptake ratios5. For each ion, then, compare its concentration in the water you add with its uptake concentration. If the water brings more per litre than the crop removes per litre, the ion climbs; if less, it falls and you must dose it.
Sodium is the usual problem because its uptake concentration is small. At 12 mmol/L of sodium in the root environment, tomato, sweet pepper and cucumber absorbed about 1.0, 0.3 and 1.3 mmol of sodium per litre of water4. Uptake rose with the concentration in the solution, and chloride was nearly always absorbed in greater quantity than sodium4.
| Crop | Na uptake concentration at under 5 mmol/L NaCl | at 12.5 mmol/L | at 25 mmol/L | Source |
|---|---|---|---|---|
| Tomato (two experiments) | 0.3, 0.6 mmol/L | 0.9, 1.1 mmol/L | 1.3, 1.4 mmol/L | 4 |
| Sweet pepper | 0.2 mmol/L | 0.3 mmol/L | 0.6 mmol/L | 4 |
| Cucumber (two experiments) | 0.2, 0.4 mmol/L | 1.2, 1.4 mmol/L | 2.0, 3.2 mmol/L | 4 |
What EC and pH drift tell you
EC measures the sum of all dissolved ions, as EC and concentration explains, so a drifting EC is the sum of all the flows above. If EC rises between checks, water is leaving faster than ions: the crop has concentrated the solution by transpiring, Resh’s “relatively greater absorption of water than of salts”1, or, in a tank topped up to constant volume, the make-up water is bringing ions faster than the crop removes them2. If EC falls, the crop is removing nutrient ions faster than you replace them. Mason gives the commercial response as a computer rule: add nutrients when EC is below the set level, flush with water when it is too high7.
EC has a blind spot in a closed system. Bar-Yosef gives the example: if nitrogen drops from 140 to 14 mg/L because replenishment fell behind, EC falls by about 1 dS/m, roughly 10 mmol of charge per litre per dS/m, and that fall can hide the rise of an accumulating ion2. Under such conditions, he writes, EC monitoring is insufficient and chloride and sodium must be measured specifically; no reliable sensor measures them continuously in place, so they are determined in a laboratory or with a test kit2. A steady EC therefore proves nothing on its own.
pH drift has its own cause, covered in pH: unbalanced absorption of anions and cations, and reactions with the growing medium1. In a closed loop the consequence is practical: Bar-Yosef notes that an elevated pH precipitates calcium carbonate and calcium phosphate that clog emitters2.
The mass balance for one ion
Keeping the books becomes a formula once the quantities have names. Let V be the volume of solution in the system in litres, E the water the crop absorbed over a period in litres, which is also the make-up water you added, C_w the concentration of the ion in the make-up water in mg/L, C_u its uptake concentration in mg per litre absorbed, and C_0 and C the tank concentrations at the start and end of the period2. With no discharge, the ion added is C_w × E, the ion removed is C_u × E, and the change is the difference spread over V2:
C = C_0 + (C_w − C_u) × E ÷ V2
This is Bar-Yosef’s ion mass-balance equation with its discharge terms set to zero: the increase in concentration is the quantity accumulated divided by the total water volume2. Three things follow. The ion stops climbing only when C_u equals C_w, so for sodium, with uptake of a few tenths of a millimole per litre against waters that can carry several millimoles, climbing is the normal state4. A larger V slows the climb and a faster-transpiring crop speeds it2. And the climb is proportional to the water’s concentration, which is why Raviv and co-authors conclude that 100% recirculation is not yet possible where the supply water contains ions the plant cannot use3.
A discharge adds one term. Sonneveld and van der Burg give the leaching fraction that holds sodium at a chosen level4:
f_d = (Na_w + Na_f − Na_c) ÷ (Na_d − Na_c)4
where f_d is the fraction of the water supplied that is drained away, Na_w the sodium in the irrigation water, Na_f the sodium added by fertiliser impurities, Na_c the crop’s uptake per litre of water absorbed, and Na_d the sodium in the drainage water, which in a closed system is the solution itself4. Semi-closed systems run this way normally cut effluent by about 90% compared with no recirculation, and a crop that tolerates a slightly higher sodium threshold needs a much smaller leaching fraction3.
Worked example: sodium in a 100 L lettuce tank
- System. V = 100 L of solution and 20 lettuce plants, both chosen for the example.
- Water use. Kratky reports nutrient solution consumption of typically 3 to 6 litres per lettuce plant over the crop, and harvest about 5 weeks from transplanting6. We take 4 L per plant and 35 days: E = 20 × 4 = 80 L per crop, or 80 ÷ 35 = 2.3 L per day6.
- Make-up water. The example tap water of Water quality, with 25 mg/L of sodium, an invented value inside Whipker’s desired level of under 50 ppm8. The fresh solution is mixed with the same water, so C_0 = 25 mg/L, ignoring sodium from fertiliser impurities4,8.
- Limit. Whipker’s upper limit for sodium in irrigation water is 69 ppm, which is 3 meq/L8. It is a water guideline, not a lettuce threshold: for fruit vegetables in rockwool, Sonneveld and van der Burg found about 12 mmol/L of sodium still acceptable at the usual EC of 3.0 dS/m4, which is 12 × 22.99 = 276 mg/L1,4. Our lettuce sources give no equivalent value, so the example uses the conservative 69 mg/L8.
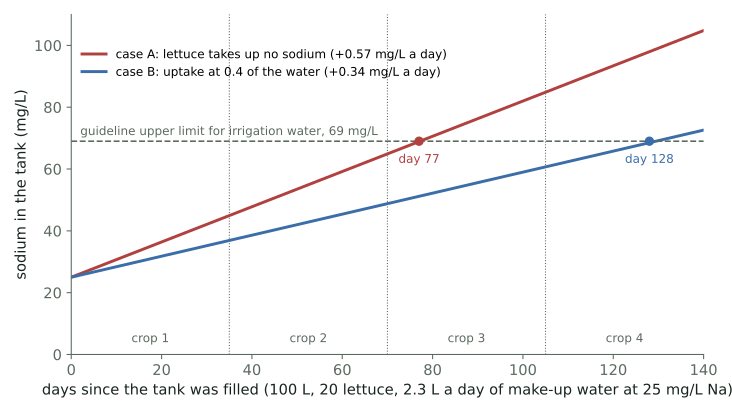
Case A, no sodium uptake. With C_u = 0, each day adds 25 mg/L × 2.3 L ÷ 100 L = 0.57 mg/L of sodium to the tank6,8. After one crop of 35 days the solution holds 25 + 0.57 × 35 = 45 mg/L, after two crops 65 mg/L, after three 85 mg/L6,8. It crosses 69 mg/L on day (69 − 25) ÷ 0.57 = 77, in the eleventh week, during the third crop6,8. Kratky’s rule is to drain and refill after every three crops or sooner; here, “sooner” applies6.
Case B, with lettuce uptake. Bar-Yosef’s table gives, for lettuce in a closed loop, 24 kg/ha of sodium taken up while 55 mm of fresh water at 110 mg/L were applied2. Bar-Yosef adds that accumulation is not a problem for a single short, low-transpiration crop such as lettuce2; our tank differs because one solution serves several crops. One millimetre over one hectare is 10 m³, so 55 mm is 550 m³ and the uptake concentration was 24 kg ÷ 550 m³ = 44 mg/L, 0.4 of the water’s concentration2. The same ratio on our water gives C_u = 10 mg/L, so the tank gains (25 − 10) × 2.3 ÷ 100 = 0.34 mg/L per day and reaches 69 mg/L on day 128, in the nineteenth week2,6,8. Sonneveld and van der Burg’s table shows uptake rising with the concentration in the root environment for fruit vegetables4. If lettuce uptake behaved the same way, the climb would slow further and would level off where uptake equals supply; as an illustration only, if uptake stayed at 0.4 of the tank concentration (our assumption, not a measurement from2), the plateau would be 25 ÷ 0.4 = 62.5 mg/L, just under the limit.
The honest answer is “between 11 weeks and never”, and the whole spread comes from the uptake term, which is what a sodium analysis near the end of a solution’s life settles2,4,6,8.
Bleed instead of replace. To hold sodium at 69 mg/L with no uptake, the leaching fraction is f_d = (25 + 0 − 0) ÷ (69 − 0) = 0.36, so 36% of all water supplied must be drained4,8. With 2.3 L per day transpired, that is 1.3 L discarded per day, 9 L per week, and 3.6 L per day of make-up4,6,8. Replacing the whole solution resets sodium to 25 mg/L and the count starts again8.
Top up, bleed or replace
The balance says what each strategy does; the sources say what it costs. Water only replaces E and nothing else: nutrients fall as the crop takes them, EC falls with them, and sodium climbs as in the example. It is the right move when EC rose because the crop concentrated the solution1. Nutrient solution replaces E and adds a full dose of every ion; Kratky reports that some lettuce growers top off with new nutrient solution while others drain and refill after each crop6. Resh warns that adding partial formulations between changes is trial and error and can build up nutrient salts that the plant takes up at relatively low rates1; the balance explains why, since any ion whose uptake concentration is below its concentration in the top-up rises with every addition.
Dosing to EC is the commercial version. Resh cites Steiner’s conclusion that if a crop’s uptake ratios are known, ions can be added continuously in those ratios under the control of a conductivity meter alone, and adds that extended use of one solution can then accumulate toxic amounts of zinc and copper from fertiliser impurities or from the water1. Mason notes that when adjustments to the EC controller no longer hold the solution, it must be replaced or the system flushed with water7. Bleeding, discarding a fraction before each refill, is the semi-closed strategy above3,4, and replacing is bleeding at 100%4. The choice belongs to the sodium count, the EC trend and, when you can afford it, an analysis, not to the calendar.
Why “every two weeks” is a rule of thumb
The rule has a respectable origin. Resh writes that in a cyclic system the life of a nutrient solution is 2 to 3 weeks depending on season and growth stage, that mature high-yielding plants in summer may need a change every week, and that the reason is differential absorption: how deficient the solution is can only be determined by laboratory analysis, so for growers who cannot analyse, the only safeguard against a nutrient disorder is to change the solution periodically1. The rule is a stand-in for an analysis, and Resh says so. He also notes that he once recommended complete replacement after 2 months, and that disinfection and computer monitoring of ions and pH now allow solutions to be kept much longer, but only with very pure raw water or reverse osmosis to remove extraneous trace elements and sodium chloride1. Kratky’s lettuce tanks run three crops6. The mass balance reconciles them: with purer water, a larger tank or a crop that takes up more sodium, the limit arrives later or never2,4,6,8. The interval is an output, not an input.
What a laboratory analysis adds
A meter gives EC and pH; an analysis gives the ions. Resh describes its two uses: the difference between concentrations at mixing and at analysis tells how much of each element to add back, and the solution must also be tested for accumulation of unused ions such as sodium, sulfate and chloride, and for excess of toxic elements such as copper and zinc1. The ions are two lists. The nutrients that fall: Mason names nitrogen, potassium, calcium, magnesium, phosphorus and iron, analysed from time to time alongside an EC controller and at least every two weeks in a large commercial operation, and notes that most laboratories take several days, often too long when a crop is changing fast7. The non-nutrients that rise: sodium, chloride and sulfate1,2. For a small system, one analysis near the planned end of a solution’s life, compared with the balance you wrote at the start, tests your uptake assumption and sets the interval for later crops with the same water. Meters and measurement covers the instruments.
Pathogens travel with the solution
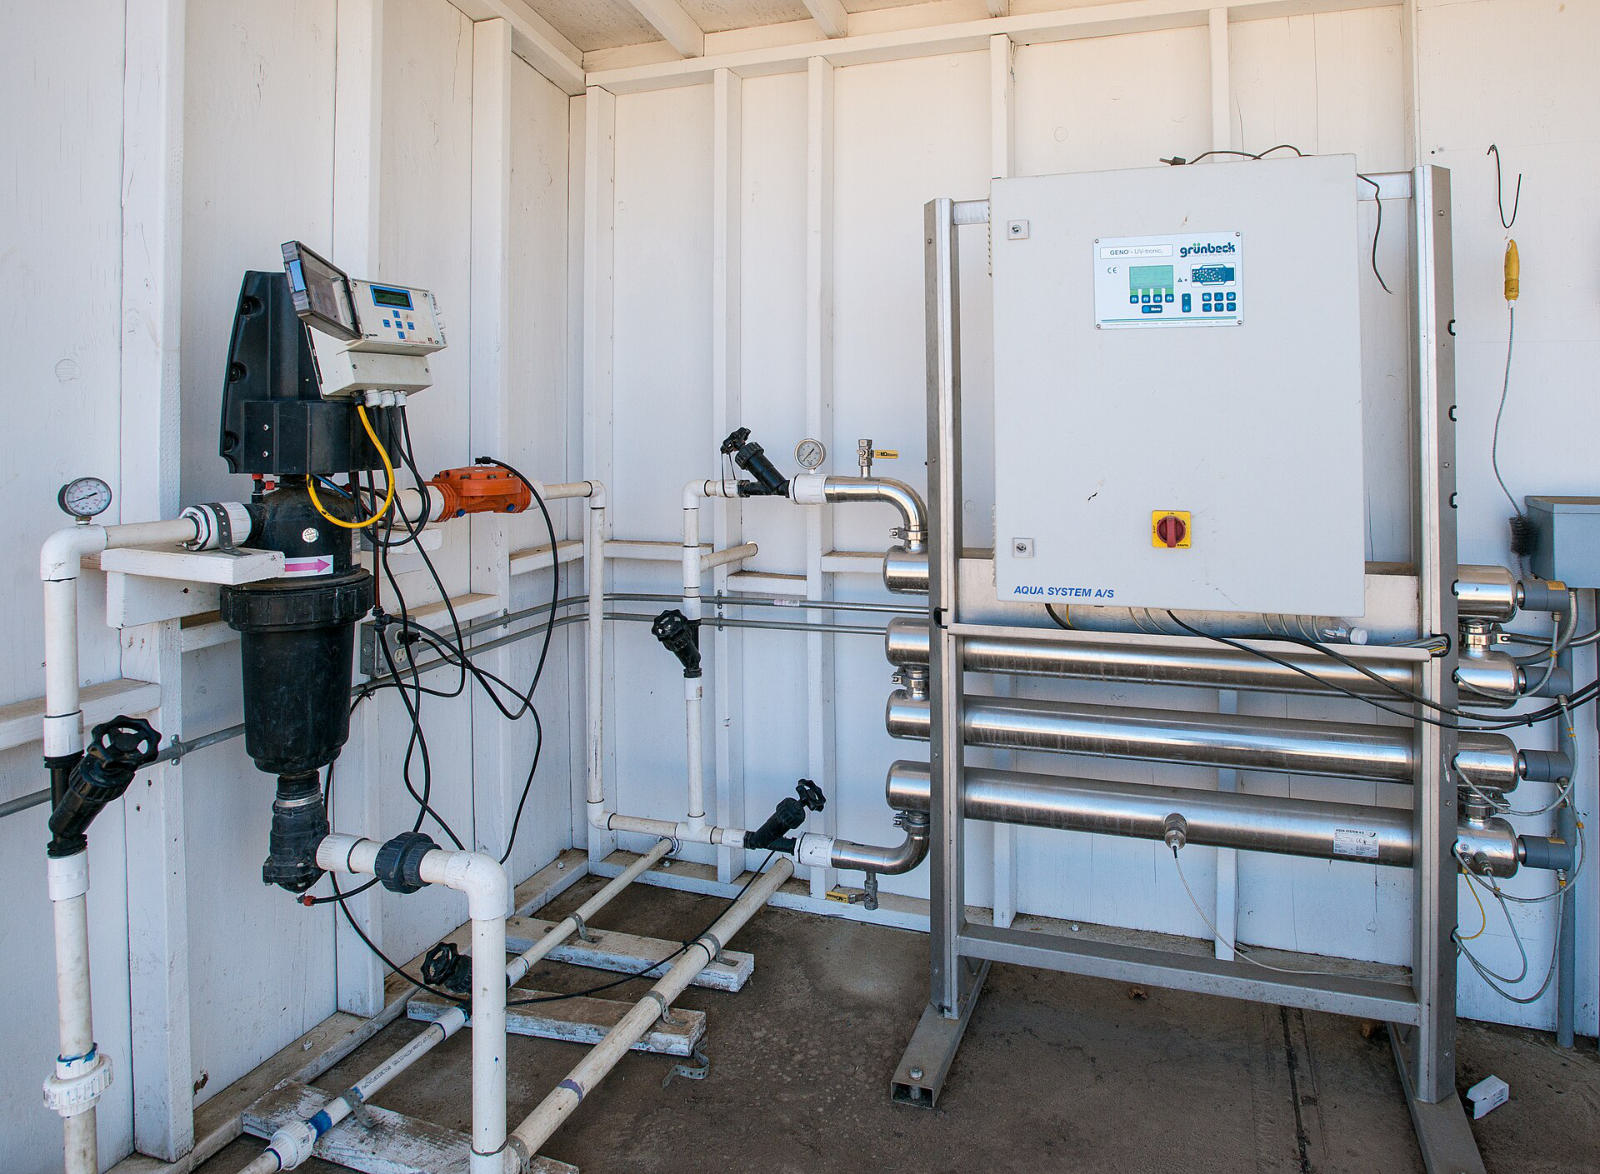
A loop carries water from every root to every other root, and Resh states the consequence: closed systems always run the risk of infection, so efficient disinfection must be part of the system1. Postma, van Os and Bonants rank the methods: heat and UV gave 99.9% elimination of pathogens including viruses; slow sand filtration removes 99.9% of the common Pythium and Phytophthora and is cheap enough for a grower to build; iodine, sodium hypochlorite, active carbon and copper ionisation did not sufficiently eliminate bacteria, fungi or viruses, and sodium hypochlorite has the added disadvantage in closed systems of adding chloride and sodium9. Pests and diseases and Hygiene, cleaning and crop turnover take this further.
Key numbers
| Quantity | Typical value or range | Conditions | Source |
|---|---|---|---|
| Life of a solution in a cyclic system | 2 to 3 weeks; weekly in summer for mature high-yielding plants | without analysis | 1 |
| Former replacement interval | 2 months, now much longer with disinfection, monitoring and pure or RO water | commercial | 1 |
| Sodium uptake concentration | 1.0, 0.3, 1.3 mmol/L for tomato, sweet pepper, cucumber | 12 mmol/L Na in root environment, rockwool | 4 |
| Acceptable Na in the root environment | about 12 mmol/L | fruit vegetables at EC 3.0 dS/m | 4 |
| Sodium in irrigation water | under 50 ppm desired, 69 ppm (3 meq/L) upper limit | Whipker et al. 2003 guideline | 8 |
| EC fall from nitrogen depletion | about 1 dS/m for 140 to 14 mg/L N; roughly 10 mmol charge/L per dS/m | closed system | 2 |
| Effluent reduction of semi-closed systems | about 90% | compared with no recirculation | 3 |
| Lettuce water use | 3 to 6 L per plant per crop; harvest about 5 weeks from transplanting | non-circulating tanks | 6 |
| Lettuce sodium uptake | 24 kg/ha over 55 mm of water at 110 mg/L; 0.4 of the water’s concentration (derived) | semi-arid closed loop | 2 |
| Worked example, Case A | 0.57 mg/L per day; 69 mg/L on day 77 | 100 L, 20 plants, 25 mg/L Na, no uptake | 6,8 |
| Worked example, bleed | leaching fraction 0.36; 1.3 L per day | same, held at 69 mg/L | 4,8 |
| Disinfection | heat and UV 99.9% elimination including viruses; slow sand filter 99.9% of Pythium and Phytophthora | recirculating solution | 9 |
Common mistakes
- Reading a steady EC as a healthy solution. EC is a sum, so a nutrient falling and sodium rising can cancel; a nitrogen drop from 140 to 14 mg/L costs about 1 dS/m2.
- Topping up with full-strength solution for weeks. Every ion whose uptake concentration is below its concentration in the top-up climbs with each addition, the build-up Resh warns about1.
- Changing the solution every two weeks regardless of the water. The interval depends on tank volume, transpiration, the water’s sodium and the crop’s uptake; Resh’s 2 to 3 weeks is a safeguard for growers without an analysis1.
- Treating a sodium value that passes the water guideline as safe for the loop. With 25 mg/L in the water, under Whipker’s desired level, the example tank crosses his upper limit within three lettuce crops6,8.
- Disinfecting with sodium hypochlorite in a closed loop. It did not sufficiently eliminate pathogens in Postma and co-authors’ comparison, and it adds sodium and chloride9.
Summary
A recirculating solution changes through three flows: the crop removes water and ions in its own proportions, the make-up water brings ions with every litre, and your dosing adds more. An ion climbs when its concentration in the added water exceeds its uptake concentration, the amount the crop removes per litre of water absorbed, and for sodium that uptake is a few tenths of a millimole per litre4. Rising EC means the crop concentrated the solution, falling EC means nutrients were removed, and a steady EC proves nothing on its own because the two can cancel1,2. The balance C = C_0 + (C_w − C_u) × E ÷ V turns this into a number: 25 mg/L of sodium in the water pushes a 100 L lettuce tank past 69 mg/L between the eleventh and the nineteenth week (day 77 to day 128), and holding it there by bleeding costs about a third of the water2,4,6,8. Replacement intervals of two or three weeks stand in for an analysis of the accumulating ions and the depleting nutrients1,7. Because the loop carries pathogens as well as ions, disinfection belongs to the design1,9.
Next in the series: Dissolved oxygen in the root zone.
References
- Resh, H. M. (2013). Hydroponic Food Production: A Definitive Guidebook for the Advanced Home Gardener and the Commercial Hydroponic Grower, 7th ed. CRC Press, Boca Raton. ISBN 978-1-4398-7869-9.
- Bar-Yosef, B. (2008). Fertigation management and crops response to solution recycling in semi-closed greenhouses. In: Raviv, M. and Lieth, J. H. (eds), Soilless Culture: Theory and Practice. Elsevier, Amsterdam. PII B978-0-444-52975-6.50011-3.
- Raviv, M., Lieth, J. H., Bar-Tal, A. and Silber, A. (2008). Growing plants in soilless culture: operational conclusions. In: Raviv, M. and Lieth, J. H. (eds), Soilless Culture: Theory and Practice. Elsevier, Amsterdam. https://doi.org/10.1016/B978-044452975-6.50015-0
- Sonneveld, C. and van der Burg, A. M. M. (1991). Sodium chloride salinity in fruit vegetable crops in soilless culture. Netherlands Journal of Agricultural Science, 39(2), 115–122. https://doi.org/10.18174/njas.v39i2.16546 (PDF: https://library.wur.nl/ojs/index.php/njas/article/download/16546/15960/17667
- Signore, A., Serio, F. and Santamaria, P. (2016). A targeted management of the nutrient solution in a soilless tomato crop according to plant needs. Frontiers in Plant Science, 7, 391. https://doi.org/10.3389/fpls.2016.00391
- Kratky, B. A. (2009). Three non-circulating hydroponic methods for growing lettuce. Acta Horticulturae, 843, 65–72.
- Mason, J. (n.d.). Commercial Hydroponics, 3rd ed. ACS Distance Education. ISBN 978-0-9871022-2-5.
- Jones, J. B. Jr. (2005). Hydroponics: A Practical Guide for the Soilless Grower, 2nd ed. CRC Press, Boca Raton. Table 7.6, after Whipker, B. E., Dole, J. M., Cavins, T. J. and Gibson, J. L. (2003).
- Postma, J., van Os, E. and Bonants, P. J. M. (2008). Pathogen detection and management strategies in soilless plant growing systems. In: Raviv, M. and Lieth, J. H. (eds), Soilless Culture: Theory and Practice. Elsevier, Amsterdam. PII B978-0-444-52975-6.50012-5.
This article was drafted with the help of AI tools and reviewed and edited by PonicLabs. Sources are listed above; tell us if you find an error.