pH: what it is and why 5.5 to 6.5
Contents
Standfirst: After reading this article you will be able to say what a pH reading measures and why one unit is a tenfold step, explain from solution chemistry why hydroponic growers keep the solution slightly acid, predict which way a running system will drift, calibrate and store a pH electrode, and correct pH without overshooting, dosing by the water’s alkalinity rather than by the pH reading alone.
Before you read: How roots take up nutrients, Water quality.
What the number measures
Water molecules split, a very few at a time, into a hydrogen ion (H⁺) and a hydroxide ion (OH⁻). In pure water the two are produced in equal numbers, and the product of their concentrations, in moles per litre, is a fixed constant of 10⁻¹⁴ at 25 °C13,16. Each is therefore present at 10⁻⁷ mol/L, and pure water is neutral, neither acid nor basic13.
pH writes that very small concentration as a convenient number: it is the negative logarithm, to base 10, of the hydrogen-ion concentration2. A concentration of 10⁻⁷ mol/L is pH 7, which is why pure water sits at 7 and why 7 is called neutral13,15. Values below 7 are acidic and values above 7 alkaline, on a scale from 0 to 147,13.
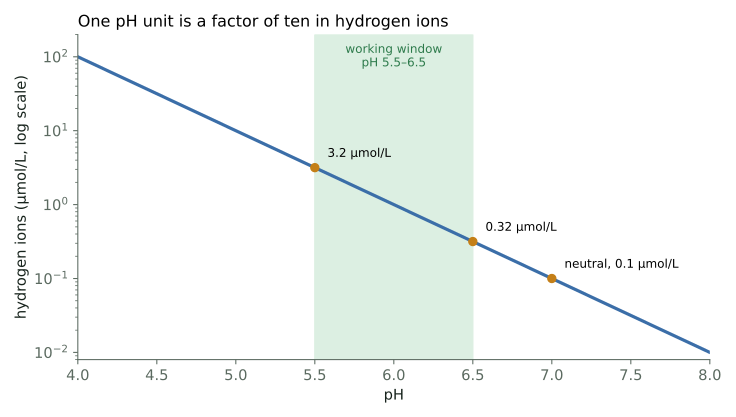
The logarithm is what catches beginners out. Each pH unit is a power of ten, so lowering the pH by one unit multiplies the hydrogen-ion concentration by ten, and a drift from 6.0 to 7.0 is a tenfold fall1,2,15.
A nutrient solution is set below neutral on purpose: a freshly mixed solution usually starts between pH 5.0 and 6.02. The reason is not that roots like acid. It is that several elements the plant needs stay dissolved only in slightly acid water.
Worked example 1: how many more hydrogen ions at pH 5.5 than at 6.5
The hydrogen-ion concentration is 10 raised to the power of minus the pH2.
- At pH 5.5: 10⁻⁵·⁵ mol/L = 3.2 × 10⁻⁶ mol/L, about 3.2 micromoles per litre2.
- At pH 6.5: 10⁻⁶·⁵ mol/L = 3.2 × 10⁻⁷ mol/L, about 0.32 micromoles per litre2.
- Ratio: 10⁻⁵·⁵ ÷ 10⁻⁶·⁵ = 10¹ = 10, so the solution at pH 5.5 holds ten times as many hydrogen ions as the one at pH 6.51,2.
For scale, calcium and magnesium are supplied at around 1.5 to 3 mmol/L4, that is 1,500 to 3,000 micromoles per litre, several hundred times the hydrogen-ion concentration at pH 5.52,4. Hydrogen ions are a trace component, which is why a small dose of acid or base moves the reading a long way in water that has nothing to resist it.
Why the window is about 5.5 to 6.5
Resh’s mixing procedure ends by adjusting the pH to between 5.8 and 6.4, depending on the crop1. Jones gives 5.8 to 6.5 for most hydroponic solutions and says adjustment is not justified unless the pH leaves 5.2 to 6.52. Jones adds a caution: very few experiments have been run to define an “ideal pH” for a nutrient solution, and the usual range comes largely from older soil data combined with crop experience2. What is firmly established is the chemistry that sets the upper edge.
The upper edge: metals and phosphate drop out of solution
Iron is the clearest case. Supplied as a simple salt such as iron sulfate, iron precipitates out of solution as iron hydroxide, and where phosphate is present it also forms insoluble iron phosphate; once precipitated it is physically unavailable to the plant3. Mason states the consequence: too high a pH precipitates iron out of hydroponic solutions and causes chlorosis of the upper leaves7. Chelates, organic molecules that hold the metal in a soluble complex, are the standard answer4, covered in Micronutrients and chelates.
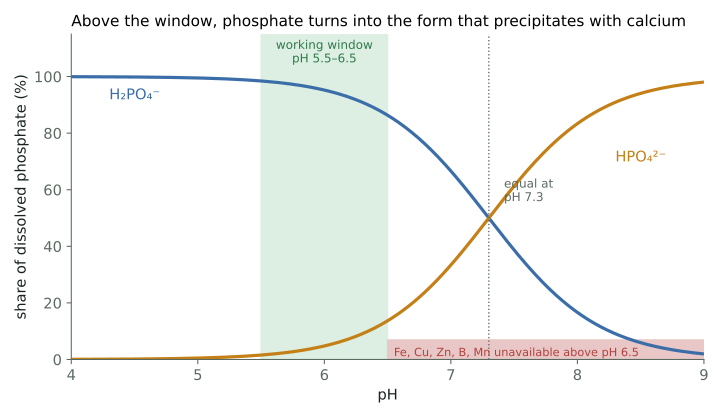
The other metals follow iron. Trejo-Téllez and Gómez-Merino state that iron, copper, zinc, boron and manganese become unavailable above pH 6.58, and Jones reports deficiencies of iron, manganese and zinc above pH 7.02. In substrates, adsorption at the usual pH 5.5 to 7.5 can pull the metal micronutrients down further, so their availability improves at acidic pH4.
Phosphate behaves differently but ends in the same place. At pH 5 essentially all of it is the singly charged ion H₂PO₄⁻; as pH rises it converts to the doubly charged HPO₄²⁻, with the halfway point at pH 7.38. The doubly charged form pairs with calcium and precipitates once the product of their concentrations is high enough8. Silber draws the general rule: precipitation of phosphorus with calcium and magnesium at neutral and high pH is to be expected in all substrates whenever nutrient concentrations are adequate for growth, and phosphorus availability should be best at pH 6.0 to 6.54.
The lower edge: roots
The lower edge is set by the plant, not by solubility. Jones states that normal growth occurs between pH 5.0 and 6.5 and that most plants are not adversely affected below 5.02; Mason is more cautious, with direct root damage below pH 4.5 and above 97. The practical window, 5.5 to 6.5, keeps clear of root damage at the bottom and precipitation at the top1,2,7.
The soil chart is not a solution chart
Almost every hydroponics book reproduces a diagram of horizontal bands whose width shows how available each nutrient is at each pH. The original is Truog’s chart from the United States Department of Agriculture Yearbook, and it describes soil7; the version in Taiz and Zeiger, from Lucas and Davis in 1961, is captioned for organic soils3. Jones says openly that the “ideal pH” for nutrient solutions “stems mostly” from such charts combined with crop experience2.
Soil has adsorbing surfaces and organic matter being mineralised; a solution has no surfaces. In soil, iron, manganese and copper are adsorbed on soil particles, which is part of why they are less available there3. In a solution the only questions are whether an ion is dissolved and in which form. Mason puts it plainly: the soil diagrams in reference books are not accurate for hydroponic crops7.
One example shows the gap. Resh’s commentary on the soil chart says that molybdenum and phosphorus availability is “greater at higher pH levels”1, which holds for soil. In a nutrient solution phosphate precipitates with calcium and magnesium at neutral and high pH, and its availability is best at 6.0 to 6.54,8. Use the soil chart to remember which elements are sensitive, and the solubility rules above to decide which way to move.
Why pH drifts in a running system
A solution with plants in it does not hold its pH, for the reason given in How roots take up nutrients.
Root uptake of nutrients is coupled to the movement of hydrogen ions across the root membrane, and roots rarely take up positive and negative ions in equal measure6. When a root takes up more anions (negative ions) than cations, it removes hydrogen ions from the solution and the pH rises; when it takes up more cations, it releases hydrogen ions and the pH falls6. The plant balances its charge, and the solution pays.
Nitrogen decides the outcome, because it can be up to 80% of all the ions a plant takes up and it comes in both charges6. Nitrate (NO₃⁻) is an anion: a plant feeding on nitrate takes up more anions than cations and raises the pH5,6. Ammonium (NH₄⁺) is a cation: a plant feeding on ammonium releases hydrogen ions, and building ammonium into amino acids releases more, so the pH falls5.
Jones gives the practical ratio: when nitrate to ammonium nitrogen in the solution exceeds about 9 to 1, the pH tends to rise with time; at 8 to 1 or less it falls2. Hershey, quoted by Jones, found ammonium much more acidifying than nitrate is alkalinising, so a small share of ammonium is enough to stabilise the pH2. Most mineral formulations are mostly nitrate, which is why the usual complaint is pH creeping upwards; Nitrogen form: nitrate, ammonium and pH control treats the ratio as a control tool.
A solution also oscillates around its set point by as much as 0.5 unit, partly through daily changes in dissolved carbon dioxide, and the pH at the root surface is set by the roots themselves; on that basis Jones calls continuous monitoring with continuous correction costly and of little benefit2.
How to measure pH
The glass electrode
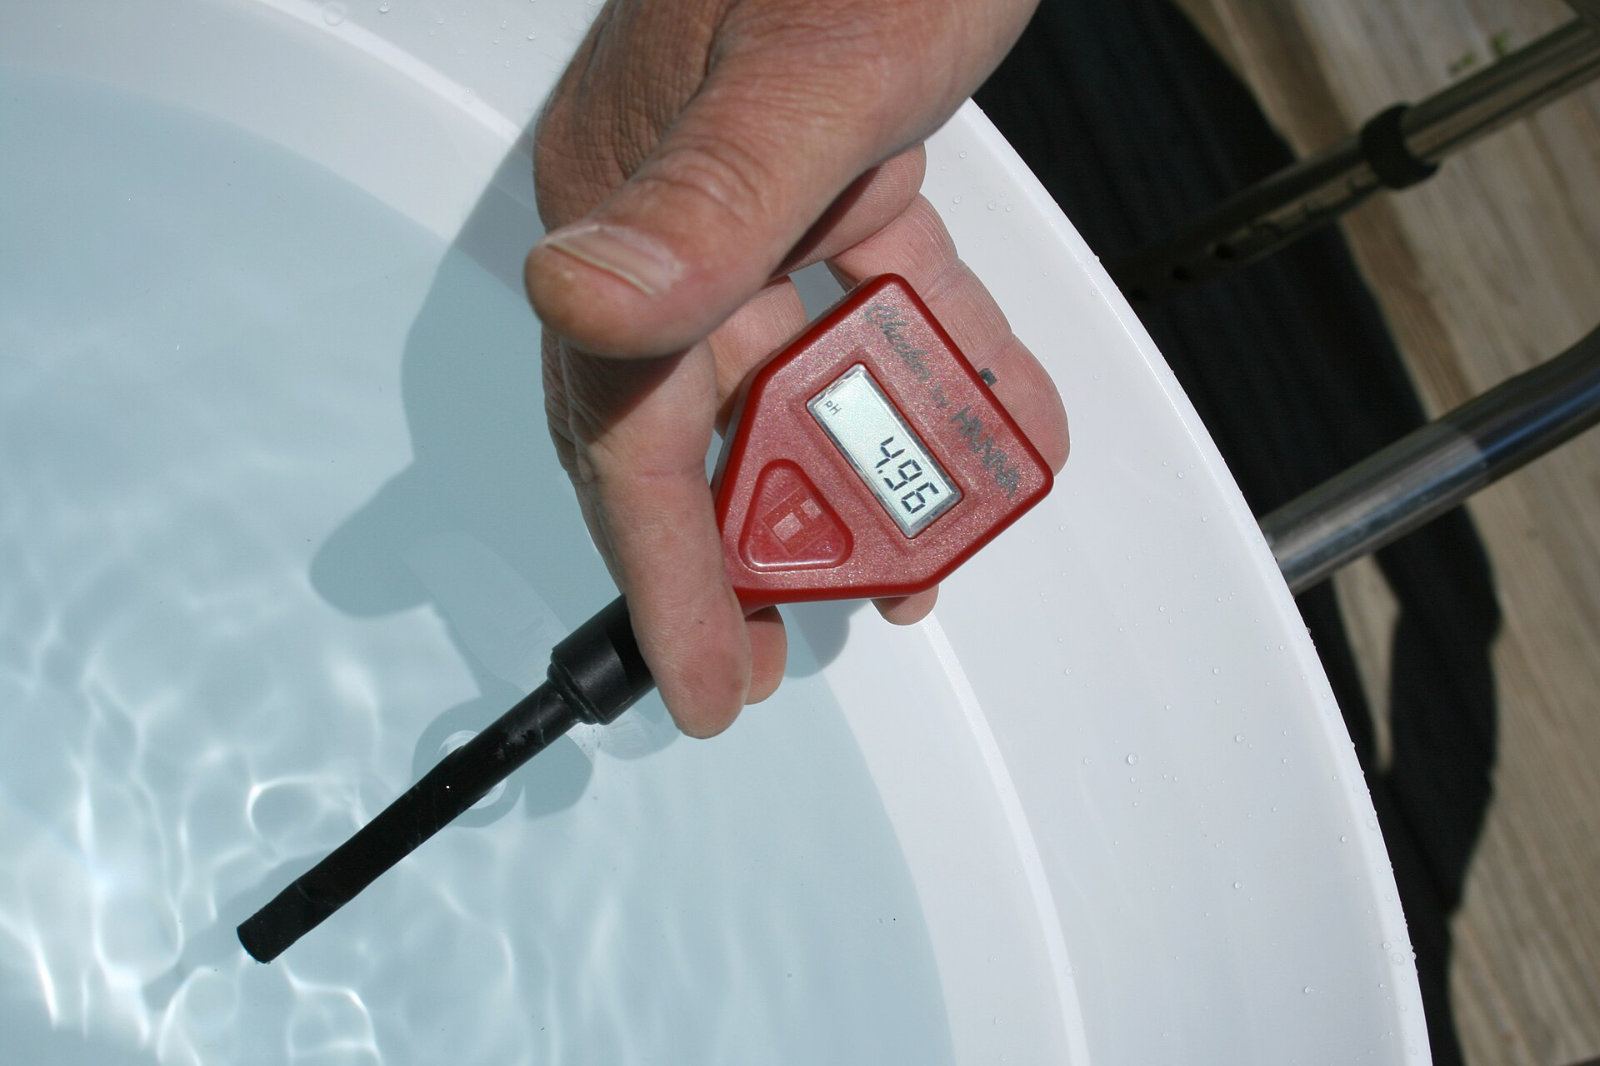
A pH meter measures a voltage. The probe holds two electrodes, one whose glass membrane responds to hydrogen ions and a reference electrode; the voltage between them depends on the hydrogen-ion concentration, and the meter converts millivolts to pH12,16. Properly calibrated meters are usually accurate to at least 0.1 pH unit16.
Calibrate with two buffers, often. The meter is calibrated by placing the probe in solutions of known pH, called buffers, and adjusting the instrument12; Jones says calibration is needed with each use2. Thermo Scientific’s guidance is a daily two-buffer calibration with buffers one to three pH units apart, accepting the electrode only if its slope is between 92% and 102% of theory, that is 54.43 to 60.34 mV per pH unit10. For a nutrient solution the natural pair is the standard pH 4.01 and pH 7.00 buffers, poured fresh into a clean container each time10; the pair should bracket the sample’s pH11.
Mind the temperature. pH readings are temperature dependent, so buffers and sample should be at the same temperature, and if they are not at 25 °C temperature compensation is recommended10. Automatic compensation corrects the electrode’s response, not the sample’s own chemistry, because each sample’s pH responds differently to temperature10,11. Record the pH with the temperature, and read at the same temperature each time10.
Store the electrode wet. Between uses, keep the probe in a pH electrode storage solution, or in pH 7 buffer with about 0.5 g of potassium chloride added per 100 mL10; Jones ties reliability directly to storage between uses2. Even with care, a probe lasts only three months to a year, so replacement must be routine12.
Indicator drops and strips
Indicator paper, or a liquid indicator added to a small sample, changes colour with pH; Lekang calls these simple but inaccurate compared with a meter12, while Stickney’s encyclopedia finds them adequate for routine monitoring16. Both are right: an indicator catches a drift towards neutral, but cannot place you within the window. Meters and measurement covers meter choice and error.
How to adjust pH
What each acid and base adds
Every adjusting chemical is also a fertiliser, or a contaminant, so the choice is as much about what it adds as about the pH. Commercial systems inject nitric acid, sulfuric acid, phosphoric acid or potassium hydroxide automatically on the return line1.
| Reagent | Direction | What it adds | Notes, with source |
|---|---|---|---|
| Phosphoric acid, H₃PO₄ | lowers pH | phosphorus | Relatively mild and safe to handle9,14; adds P that must be counted in the feed; neutralising 6 meq/L of alkalinity with it supplies about 126 mg/L P at every irrigation, which Bailey calls a high level of phosphorus9 |
| Nitric acid, HNO₃ | lowers pH | nitrate nitrogen | At 67% strength the most hazardous of the three to handle9; neutralising 6 meq/L of alkalinity supplies about 67 mg/L N9 |
| Sulfuric acid, H₂SO₄ | lowers pH | sulfur as sulfate | Bailey’s recommended acid for ease, safety, cost and availability at 35% strength9; 6 meq/L of alkalinity gives about 75 mg/L S9; FAO warns beginners off it because of its corrosiveness14 |
| Hydrochloric acid, HCl | lowers pH | chloride | Listed by Jones as usable2; chloride is kept as low as possible in NFT targets2 |
| Citric acid | lowers pH | an organic chelating acid | Historically added with iron as a chelator3; FAO advises against it in aquaponics because it is antimicrobial and can kill biofilter bacteria14 |
| Potassium hydroxide, KOH | raises pH | potassium | The standard base in hydroponics1,2; a strong base, add slowly14 |
| Sodium hydroxide, NaOH | raises pH | sodium | Jones’s preference because it adds no essential element2; sodium accumulates in recirculating systems14, see Managing a recirculating solution over time |
| Potassium carbonate, K₂CO₃, and potassium bicarbonate, KHCO₃ | raise pH and alkalinity | potassium plus carbonate | FAO describes carbonates as a safer, easier way to raise pH that also raises carbonate hardness, the buffering14; sodium bicarbonate is avoided because sodium accumulates14 |
Jones prefers reagents that add no essential element, sodium hydroxide as the base and sulfuric or hydrochloric acid as the acid, and warns that phosphoric acid adds phosphorus and nitric acid adds nitrate2; Resh’s formulations count nitric and phosphoric acid as part of the nutrient supply1. What is not defensible is dosing phosphoric acid for weeks without reducing the phosphate in the feed: Bailey’s instruction is to adjust the fertiliser programme for the nutrient the acid supplies9. On citric acid in a mineral system we found no primary source describing how long its effect lasts; the FAO objection concerns biofilters rather than plants14.
Safety
Concentrated acids are dangerous to the operator and to the system14. Wear safety goggles, gloves and protective clothing for any acid, and never add water to acid; always add acid to water9,14. Bailey ranks 75% phosphoric acid and 35% sulfuric acid as relatively safe to work with compared with 67% nitric acid9. Acidified water corrodes galvanised pipe and fittings, and an injector used for acid should be approved for it by its manufacturer9. Strong bases deserve the same handling14.
Adjust slowly, then wait
Two reasons argue for small steps. First, the buffering in the water means that the first acid you add produces no visible change: FAO describes how the acid reacts with the buffers while the reading stays put, more acid goes in, and then, once the buffers are exhausted, the pH drops drastically14. Second, a tank takes time to mix: Resh’s procedure is to adjust, circulate for 5 to 10 minutes, check again and adjust again, and when making an iron-chelate stock solution that must be held at pH 5.5 with potassium hydroxide, he adds part of the dose and adds more only if the pH falls below 5.01. Jones’s rule, adjust only when the pH is outside the range2, is the safe default for a hand-dosed system.
The dose depends on alkalinity, not on the pH reading
Alkalinity is a water’s capacity to neutralise acids, reported in milligrams per litre of calcium carbonate equivalent; it must not be confused with “alkaline”, which only means a pH above 79. Alkalinity is what the acid has to consume before the pH moves, so it sets the dose far more than the starting pH does9. Alkalinity and buffering does the full calculation; here is the illustration.
Worked example 2: two waters, two acid demands
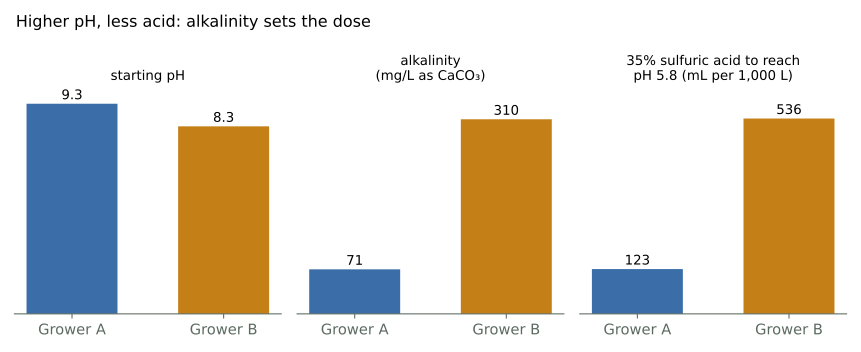
Bailey compares two growers’ waters, both brought to pH 5.8 with 35% sulfuric acid9:
- Grower A: pH 9.3, alkalinity 71 mg/L CaCO₃; acid needed 46.6 mL per 100 US gallons9.
- Grower B: pH 8.3, alkalinity 310 mg/L CaCO₃; acid needed 203.0 mL per 100 US gallons9.
With 1 US gallon = 3.785 L1, 100 US gallons is 378.5 L, so the doses are 46.6 ÷ 378.5 × 1,000 = 123 mL per 1,000 L for Grower A and 203.0 ÷ 378.5 × 1,000 = 536 mL per 1,000 L for Grower B1,9. The dose ratio is 203.0 ÷ 46.6 = 4.369, so Grower B’s water starts a full pH unit lower yet needs more than four times the acid9. The alkalinity ratio is 310 ÷ 71 = 4.379. Bailey’s doses are set by alkalinity alone: per milligram per litre of alkalinity, both waters need about 1.7 mL of this acid per 1,000 L (123 ÷ 71 = 1.73; 536 ÷ 310 = 1.73)1,9.
Pure water is the limiting case: hydrogen and hydroxide ions in equal, tiny amounts and nothing else to consume an acid13, so a single drop moves the reading at once. Rainwater is close to this; FAO calls it “KH-free”, free of carbonate hardness14. A grower on rainwater or reverse-osmosis water must dose in very small amounts, while one on hard well water can add acid for some time before anything happens, and then sees the pH collapse14. Alkalinity is the number to read first on a water report, as Water quality explained.
Crop preferences
Published preferences differ by a few tenths of a unit, less than the daily drift of a hand-managed tank, so treat them as targets rather than limits.
| Crop | Published pH preference | Source |
|---|---|---|
| Tomato | optimum 5.8 to 6.0 | Mason7 |
| Tomato in NFT | 5.5 (minimum) to 6.5 (maximum), optimum 6.0; Papadopoulos’s targets as reported by Jones | Jones2 |
| Lettuce | 6.0 to 6.2 | Mason7 |
| Culinary herbs (basil, mint, thyme, oregano and others) | 5.8 to 6.2, conditions similar to lettuce | Resh1 |
| Most crops, at mixing | 5.8 to 6.4 depending on the crop | Resh1 |
| 22 hydroponic crops surveyed by Morgan | 5.0 to 7.5 across species | Jones2 |
Key numbers
| Quantity | Typical value or range | Conditions | Source |
|---|---|---|---|
| Ion product of water | 10⁻¹⁴ (mol/L)² | pure water; H⁺ = OH⁻ = 10⁻⁷ mol/L, pH 7 | 13 |
| Change per pH unit | tenfold in H⁺ concentration | by definition of pH | 1,2,15 |
| H⁺ at pH 5.5 and 6.5 (derived) | 3.2 and 0.32 µmol/L | from the definition | 2 |
| Working range, most hydroponic crops | 5.8 to 6.4 (Resh); 5.8 to 6.5 (Jones); adjust only outside 5.2 to 6.5 (Jones) | nutrient solution or inert medium | 1,2 |
| Fresh solution pH | 5.0 to 6.0 | as initially constituted | 2 |
| Fe, Cu, Zn, B, Mn | become unavailable above pH 6.5 | nutrient solution | 8 |
| Fe, Mn, Zn deficiencies | likely above pH 7.0 | tomato nutrient solution | 2 |
| Phosphate species crossover | pH 7.3 (H₂PO₄⁻ to HPO₄²⁻) | solution | 8 |
| Best phosphorus availability | pH 6.0 to 6.5 | substrates, Ca and Mg at adequate levels | 4 |
| Ca and Mg carbonate precipitation | above pH 8.3 | water containing bicarbonate | 8 |
| Root damage | below pH 4.5 and above 9 (Mason); normal growth 5.0 to 6.5 (Jones) | 2,7 | |
| Nitrate to ammonium ratio and drift | above 9:1 pH rises; 8:1 or lower pH falls | with plants, over days | 2 |
| Nitrogen share of total ion uptake | up to 80% | higher plants | 6 |
| Natural oscillation of solution pH | up to 0.5 unit | around its set point | 2 |
| Electrode slope accepted | 92% to 102%, 54.43 to 60.34 mV per pH unit | daily two-buffer check | 10 |
| Meter accuracy | at least 0.1 pH unit | calibrated | 16 |
| Electrode storage | storage solution, or pH 7 buffer with 0.5 g KCl per 100 mL | between uses | 10 |
| Probe lifetime | 3 months to 1 year | with maintenance | 12 |
| Acid to reach pH 5.8 | 46.6 mL (alkalinity 71 mg/L) vs 203.0 mL (310 mg/L) per 100 US gal | 35% sulfuric acid | 9 |
| Same, per 1,000 L (derived) | 123 vs 536 mL; about 1.7 mL per mg/L alkalinity | 1 US gal = 3.785 L | 1,9 |
| Nutrient added by neutralising 6 meq/L alkalinity | about 126 mg/L P (phosphoric), 67 mg/L N (67% nitric), 75 mg/L S (sulfuric) | per irrigation | 9 |
Common mistakes
- Reading the soil availability chart as a solution chart. In a solution, phosphate precipitates with calcium at neutral and high pH, the opposite of what the soil chart implies1,4,7,8.
- Dosing acid by the pH reading alone. Alkalinity consumes the acid before the pH moves, so a water a full pH unit lower can still need more than four times the acid9.
- Adding the whole dose at once. Buffers absorb the first additions without a visible change, then the pH collapses1,14.
- Dosing phosphoric acid for weeks without reducing phosphate in the feed. Neutralising a high-alkalinity water with it can supply over 100 mg/L P at each irrigation9.
- Calibrating with one buffer, or letting the electrode dry out. A glass electrode drifts and ages, and its storage between uses decides its reliability2,10,12.
- Expecting a mostly nitrate solution to hold its pH. Nitrate uptake removes hydrogen ions from the solution, so the pH climbs2,5,6.
Summary
pH is the negative logarithm of the hydrogen-ion concentration, so each unit is a tenfold step, and pure water is pH 7 because its hydrogen and hydroxide ions are equal at 10⁻⁷ mol/L2,13. Hydroponic solutions are kept between about 5.5 and 6.5 because above that range iron, manganese, zinc, copper and phosphate precipitate or change form, and below it roots suffer1,2,4,7,8. The banded availability chart was drawn for soil, not for a solution3,7. A running system drifts because roots balance their charge with hydrogen ions: nitrate feeding pushes pH up, ammonium pushes it down2,5,6. Measure with a glass electrode calibrated against two buffers, stored wet, and replaced when its slope falls out of range10,12. Adjust in small steps, with a reagent whose added element you have accounted for1,2,14. The acid you need is set by the water’s alkalinity, not by its pH reading9.
Next in the series: Alkalinity and buffering: the hidden control of pH drift.
References
- Resh, H. M. (2013). Hydroponic Food Production: A Definitive Guidebook for the Advanced Home Gardener and the Commercial Hydroponic Grower, 7th ed. CRC Press, Boca Raton. ISBN 978-1-4398-7869-9.
- Jones, J. B. Jr. (2005). Hydroponics: A Practical Guide for the Soilless Grower, 2nd ed. CRC Press, Boca Raton.
- Taiz, L. and Zeiger, E. (2002). Plant Physiology, 3rd ed. Sinauer Associates, Sunderland, MA. Chapter 5, Mineral Nutrition.
- Silber, A. (2008). Chemical characteristics of soilless media. In: Raviv, M. and Lieth, J. H. (eds), Soilless Culture: Theory and Practice. Elsevier, Amsterdam, pp. 209–244. PII B978-0-444-52975-6.50008-3.
- Bar-Yosef, B. (2008). Fertigation management and crops response to solution recycling in semi-closed greenhouses. In: Raviv, M. and Lieth, J. H. (eds), Soilless Culture: Theory and Practice. Elsevier, Amsterdam. PII B978-0-444-52975-6.50011-3.
- Neumann, G. and Römheld, V. (2012). Rhizosphere chemistry in relation to plant nutrition. In: Marschner, P. (ed.), Marschner's Mineral Nutrition of Higher Plants, 3rd ed. Academic Press, London, pp. 347–368. https://doi.org/10.1016/B978-0-12-384905-2.00014-5
- Mason, J. (n.d.). Commercial Hydroponics, 3rd ed. ACS Distance Education. ISBN 978-0-9871022-2-5.
- Trejo-Téllez, L. I. and Gómez-Merino, F. C. (2012). Nutrient solutions for hydroponic systems. In: Asao, T. (ed.), Hydroponics: A Standard Methodology for Plant Biological Researches. InTech, Rijeka, pp. 1–22. Book DOI https://doi.org/10.5772/2215
- Bailey, D. A. (1994). Water acidification. North Carolina Flower Growers' Bulletin, 39(3), June 1994. North Carolina State University, Department of Horticultural Science. https://hortscans.ces.ncsu.edu/uploads/w/a/water_ac_53e4f43e11d8a.pdf
- Thermo Fisher Scientific (n.d.). pH calibration procedure for optimal measurement precision. Thermo Scientific Orion technical note. https://qa1-assets.thermofisher.cn/TFS-Assets/CMD/Product-Bulletins/TN-ph-calibration-procedure-for-optimal-measurement-precision-T-PHCAL-EN.pdf
- HORIBA (n.d.). Automatic temperature compensation in pH measurement. Technical tips, bench meters. https://www.horiba.com/int/water-quality/support/technical-tips/bench-meters/automatic-temperature-compensation-in-ph-measurement/
- Lekang, O.-I. (2013). Aquaculture Engineering, 2nd ed. Wiley-Blackwell, Chichester. Section 24.3.3, Measuring pH.
- Boyd, C. E. (2012). Water quality. In: Lucas, J. S. and Southgate, P. C. (eds), Aquaculture: Farming Aquatic Animals and Plants, 2nd ed. Wiley-Blackwell, Chichester. ISBN 978-1-4051-8858-6.
- Somerville, C., Cohen, M., Pantanella, E., Stankus, A. and Lovatelli, A. (2014). Small-scale aquaponic food production: integrated fish and plant farming. FAO Fisheries and Aquaculture Technical Paper No. 589. FAO, Rome. ISBN 978-92-5-108532-5.
- Madigan, M. T., Martinko, J. M., Stahl, D. A. and Clark, D. P. (2012). Brock Biology of Microorganisms, 13th ed. Pearson, San Francisco. Section 5.15, Acidity and alkalinity.
- Stickney, R. R. (ed.) (2000). Encyclopedia of Aquaculture. John Wiley & Sons, New York. Entry "pH".
This article was drafted with the help of AI tools and reviewed and edited by PonicLabs. Sources are listed above; tell us if you find an error.