Photosynthesis and respiration for growers
Contents
Standfirst: After reading this article you will be able to say where the mass of a plant comes from, read a light-response curve and name the three environmental factors that cap photosynthesis, turn a light-meter reading and a photoperiod into a daily light integral and compare it with a published lettuce target, and explain why roots in a nutrient solution need dissolved oxygen and why warm nights cost growth.
Before you read: What a plant needs, How plants are built.
Where the mass of a plant comes from
A plant is mostly water. Fresh plant matter is about 80% to 95% water, and the exact share depends on the species and on how turgid the plant is when it is sampled2. What remains after drying is the dry matter, and over 90% of the dry weight of most plant matter is three elements: carbon, oxygen and hydrogen2. Water supplies the hydrogen and part of the oxygen; the carbon, and the rest of the oxygen, come from carbon dioxide in the air2. In a standard table of tissue composition, carbon alone is 45% of dry matter1.
This is the first fact a grower should hold on to. The nutrient solution supplies the mineral elements, a small fraction of the plant, as What plants are made of explains. The carbon skeleton of every sugar, cell wall and protein is taken from the air through the leaves. Roots deliver water and minerals, not carbon.
The process that captures the carbon is photosynthesis, a word that means “synthesis using light”1. In words: carbon dioxide and water, with light energy, become carbohydrate and oxygen. In symbols1:
6 CO₂ + 6 H₂O + light → C₆H₁₂O₆ + 6 O₂1
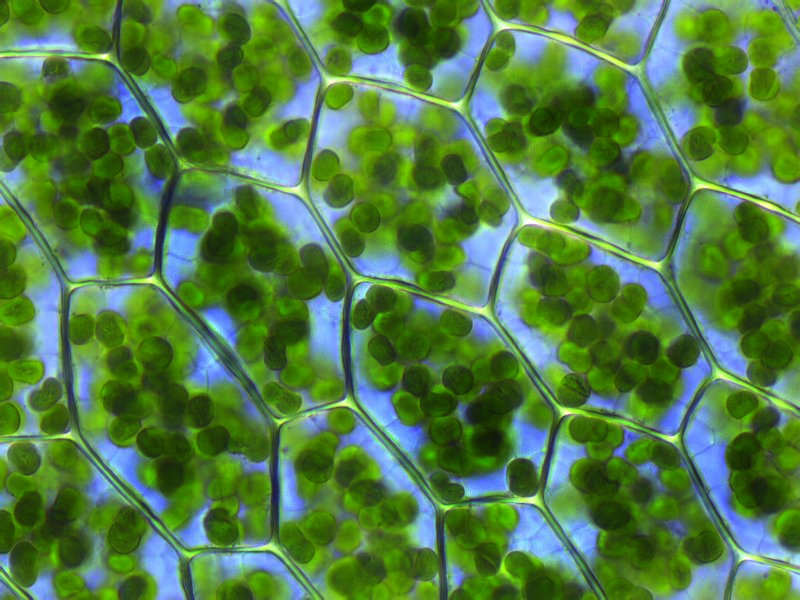
The sugar on the right stores the light energy as chemical energy, which the plant spends later to build and run every cell1. The most active photosynthetic tissue is the mesophyll inside the leaf, whose cells hold many chloroplasts, and the chloroplasts hold the green pigments, the chlorophylls1.
Two stages, and why it matters which one is slow
Photosynthesis runs as two linked stages inside the chloroplast. The first stage is the light reactions: light excites chlorophyll, and the plant uses that energy to oxidize water, which releases oxygen, and to make two energy carriers, ATP and NADPH1. The second stage is carbon fixation, called the Calvin cycle, which spends those carriers to turn CO₂ into sugar phosphates. The cycle consumes two molecules of NADPH and three molecules of ATP for every molecule of CO₂ fixed1. At steady state only one-sixth of the sugar phosphate it makes is exported to build sucrose or starch; the other five-sixths are recycled to regenerate the molecule that accepts the next CO₂1.
The distinction matters because each stage has its own bottleneck. The light reactions run as fast as photons arrive. The carbon reactions run as fast as CO₂ reaches the fixing enzyme, rubisco, and as fast as enzymes work at the leaf’s temperature. Whichever stage is slower sets the pace for both, so light, CO₂ and temperature can each become the limit, and adding more of one stops helping once another has taken over.
Light: the light-response curve
If you measure the CO₂ uptake of a leaf at increasing light, you get its light-response curve1. In the dark the leaf takes up no CO₂. It releases CO₂, because its cells respire, so by convention net assimilation is negative in that part of the curve1. As light increases, photosynthesis increases until CO₂ uptake exactly balances the CO₂ released by respiration. That light level is the light compensation point1. For plants grown in full sun it is typically 10 to 20 µmol m⁻² s⁻¹; for shade plants it is 1 to 5 µmol m⁻² s⁻¹, because shade plants respire slowly1. Below its compensation point a leaf loses carbon, however long the light stays on.
Above the compensation point, photosynthesis rises in proportion to light: the curve is a straight line and photosynthesis is light-limited1. At higher light the curve bends over and reaches saturation, after which more light gives no more photosynthesis1. Past the saturation point photosynthesis is described as CO₂-limited, because the Calvin cycle enzymes can no longer keep pace with the energy the light reactions deliver1. The light-response curve of most leaves saturates between 500 and 1000 µmol m⁻² s⁻¹, well below full sunlight, which is about 2000 µmol m⁻² s⁻¹1. A leaf grown under low light saturates at a lower level than a leaf of the same species grown in bright light, so the curve itself depends on how the plant was raised1.
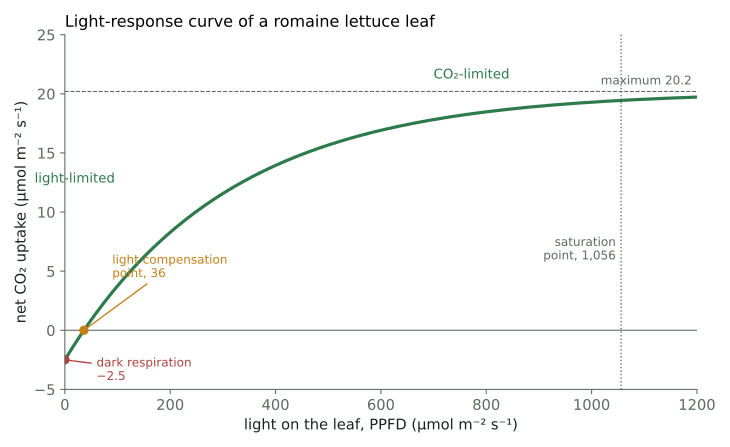
Here are measured values for one crop. Zhou and co-workers grew romaine lettuce in small plant factories at 250 µmol m⁻² s⁻¹, 400 ± 50 ppm CO₂, and light and dark periods of 12 hours each, and measured leaf light-response curves with the leaf held at 25 °C and 400 µmol mol⁻¹ CO₂3. For those plants the light compensation point was 36.2 µmol m⁻² s⁻¹, the light saturation point 1,056 µmol m⁻² s⁻¹, the maximum net photosynthesis 20.2 µmol CO₂ m⁻² s⁻¹ and the dark respiration rate 2.5 µmol CO₂ m⁻² s⁻¹3. The lettuce compensation point is higher than the textbook range for sun plants, and its saturation point sits at or just above the top of the textbook range for leaves in general1,3.
One caution. These are single leaves in a measuring chamber. A whole plant shades its own leaves, so a canopy rarely saturates even when its top leaves do, and crop yield tracks the total light received over the growing period, provided water and nutrients are adequate1. This is why growers count light per day, not only per second.
Why only 400 to 700 nm counts, and how light is counted
Sunlight contains many wavelengths, but only photons between 400 and 700 nm are used in photosynthesis1. This band is called photosynthetically active radiation, or PAR1. A leaf absorbs about 85% to 90% of the PAR that reaches it; the rest is reflected or transmitted, and because chlorophyll absorbs strongly in the blue and the red, the light that comes back is enriched in green1. Resh gives the useful band as 400 to 720 nm, a slightly wider definition at the red end2. Because the Calvin cycle counts molecules, not joules, plant scientists count photons. PAR expressed as photons per area per second is the photosynthetic photon flux density, PPFD, in µmol m⁻² s⁻¹1. Direct sunlight gives about 2000 µmol m⁻² s⁻¹, which is about 400 W m⁻² in energy units1. Lux and foot-candles are weighted to the human eye, which is most sensitive to green, so they do not describe what a plant receives7.
PPFD is an instantaneous reading7. Because yield follows total light, the quantity growers plan around is the daily light integral, DLI: the amount of PAR received per square metre in one day, in moles per square metre per day, mol m⁻² d⁻¹7. The Purdue bulletin compares DLI to a rain gauge, which collects everything that falls over a period7. For a constant PPFD over 24 hours, DLI = PPFD × 0.0864, where 0.0864 is the number of seconds in a day divided by one million7. The same arithmetic applied to the lit hours only: multiply the PPFD by 3,600 seconds per hour and by the hours of light, then divide by one million to convert micromoles to moles (the 0.0864 factor is 24 × 3,600 ÷ 1,000,0007). Light: PPFD, DLI, spectrum and photoperiod treats spectrum, measurement and crop targets in detail, and Choosing and sizing grow lights covers lamps.
Worked example: a lettuce daily light integral
Every input is sourced; you can redo the arithmetic with a calculator.
- Light level and photoperiod. The plant factory study above lit its lettuce at a PPFD of 250 µmol m⁻² s⁻¹ for 12 hours of each 243.
- Target. In the Cornell greenhouse trials, butterhead lettuce reached marketable heads of 150 g fresh weight 24 days after transplanting when it received an average light integral of 17 mol m⁻² d⁻¹4. The same programme reported heads of about 150 g at 35 days after seeding with 17 mol m⁻² d⁻¹ at ambient CO₂, and tipburn when more than 17 mol m⁻² d⁻¹ was given5. Its production handbook recommends 17 mol m⁻² d⁻¹ for lettuce, delivered with supplemental lighting of 100 to 200 µmol m⁻² s⁻¹ on top of sunlight6.
The calculation:
- DLI = 250 µmol m⁻² s⁻¹ × 3,600 s h⁻¹ × 12 h = 10,800,000 µmol m⁻² d⁻¹ = 10.8 mol m⁻² d⁻¹3,7.
- Compared with the target: 10.8 ÷ 17 = 0.64, so the plants received about 64% of the Cornell target, a shortfall of 6.2 mol m⁻² d⁻¹3,4.
- Hours needed at 250 µmol m⁻² s⁻¹ to reach 17 mol m⁻² d⁻¹: 17,000,000 ÷ (250 × 3,600) = 18.9 hours4,7.
A check against an independent figure: the Cornell handbook lights seedlings at 250 µmol m⁻² s⁻¹ for 24 hours and states the result as about 22 mol m⁻² d⁻¹6. With the Purdue factor, 250 × 0.0864 = 21.6 mol m⁻² d⁻¹, which rounds to 226,7.
The target is not a law of nature. It worked best for one butterhead cultivar in one greenhouse; for some cultivars 15 mol m⁻² d⁻¹ is the most that can be given before tipburn appears, and without strong vertical airflow the trials could not go above 12 mol m⁻² d⁻¹6. It also depends on CO₂: with the air enriched to about 1,300 ppm CO₂, 12 mol m⁻² d⁻¹ produced the same 7 g of shoot dry mass as 17 mol m⁻² d⁻¹ at ambient CO₂5.
CO₂: the second limit
The Calvin cycle needs a supply of CO₂, and the supply is thin. The air normally holds about 0.036% CO₂, which is 360 ppm1; the Cornell handbook puts outdoor air at around 390 ppm6. Plotting photosynthesis against the CO₂ concentration inside the leaf gives a curve with the same shape as the light curve. At very low CO₂, respiration continues while photosynthesis is starved, and the leaf loses CO₂1. The concentration at which the two balance is the CO₂ compensation point, the counterpart of the light compensation point1. Above it, in C3 plants, the group to which lettuce and most greenhouse vegetables belong, raising CO₂ keeps stimulating photosynthesis over a wide concentration range1. At low to intermediate CO₂ the limit is how fast rubisco can fix carbon; at high CO₂ the limit becomes how fast the cycle can regenerate its acceptor, which depends on the light reactions1.
The practical consequence runs both ways. In a closed greenhouse on a bright day the plants themselves can draw the CO₂ down to 100 ppm, which severely reduces photosynthesis, and raising it to 1,000 to 1,500 ppm speeds growth6. CO₂ and air movement covers when enrichment pays.
Temperature: the third limit
Plot photosynthesis against leaf temperature and the curve is bell-shaped: it rises to an optimum and then falls, partly through reversible slowing and partly through damage1. When CO₂ is plentiful the rate depends strongly on temperature. At normal air CO₂ the response is flatter, because warming speeds the carboxylation reaction but also lowers the affinity of rubisco for CO₂, and the two effects partly cancel1. Respiration and photorespiration, a wasteful side reaction of rubisco with oxygen, both rise with temperature, so in C3 plants the carbon gained per photon falls as the leaf warms1. The optimum differs between species and between plants of the same species raised in different climates1. Temperature, humidity and VPD gives crop targets.
Respiration: the reverse reaction, in every cell, day and night
Photosynthesis stores energy in sugar; respiration gets it back out. In respiration, reduced carbon compounds are oxidized in a controlled way and the energy released is stored briefly as ATP, the molecule that powers maintenance and growth1. Written for sucrose, the plant’s transport sugar, the net reaction is1:
C₁₂H₂₂O₁₁ + 12 O₂ → 12 CO₂ + 11 H₂O1
Taiz and Zeiger call this “the reversal of the photosynthetic process”1. Sugar and oxygen go in; CO₂, water and usable energy come out. Oxidizing one mole of sucrose, 342 g, releases 5,760 kJ1.
Three features of respiration matter to a grower. First, where it happens: only green tissues photosynthesize, but all tissues respire, and they do so 24 hours a day1. Second, how much it costs. In a survey of herbaceous species, 30% to 60% of the daily gain in photosynthetic carbon was lost again to respiration, with the share tending to fall as plants aged1. In tropical conditions the loss can reach 70% to 80% of the daily gain, because of the high respiration rates that go with warm nights1. Third, how it responds to temperature. Between 0 and 30 °C, respiration roughly doubles for every 10 °C rise; above 30 °C it increases more slowly, reaches a plateau at 40 to 50 °C and then falls1. Photosynthesis stops when the lights go off, but respiration continues, and a warm dark period burns more of the day’s sugar than a cool one.
Net growth is therefore photosynthesis minus respiration. The light-response curve already shows this: its zero line is the compensation point, where the two are equal, and the dark respiration rate is the intercept below it1. What is left after every cell has respired, day and night, is what becomes new plant.
Roots respire too: why the solution needs oxygen
Roots have no chlorophyll. They live on sugar sent down from the leaves and oxidize it with oxygen, exactly as the leaf does in the dark. Oxygen is a substrate of respiration, so its supply can limit the rate1. In air the supply is rarely a problem; respiration of whole tissues only slows when the surrounding oxygen falls below about 5%1. In water the picture changes, because oxygen diffuses slowly through an aqueous phase, and this diffusion limit becomes more serious when an organ grows in a liquid medium1. Water in equilibrium with air at 25 °C holds about 250 µmol of O₂ per litre1, which, at 32 g per mole of O₂, is about 8 mg per litre. That is all the oxygen a root in a still solution can draw on, and a bed of respiring roots can use it up.
Taiz and Zeiger draw the conclusion for us: when plants are grown hydroponically, the solutions must be aerated vigorously to keep oxygen high around the roots1. The Cornell lettuce programme reports that lettuce grows satisfactorily at a dissolved oxygen level of at least 4 ppm, that its ponds were held at 8 ppm, and that if no oxygen is added the level drops to nearly zero, respiration stops and the plant dies6. Oxygen solubility, root demand and aeration are the subject of Dissolved oxygen in the root zone.
Key numbers
| Quantity | Typical value or range | Conditions | Source |
|---|---|---|---|
| Water in fresh plant matter | 80% to 95% | varies with species and turgor | 2 |
| Carbon, oxygen and hydrogen in dry matter | over 90% | most plant matter | 2 |
| Carbon in dry matter | 45% | standard tissue table | 1 |
| Energy carriers used per CO₂ fixed | 3 ATP and 2 NADPH | Calvin cycle | 1 |
| Light compensation point | 10 to 20 µmol m⁻² s⁻¹ (sun plants); 1 to 5 (shade plants) | leaf measurements | 1 |
| Light saturation of most leaves | 500 to 1000 µmol m⁻² s⁻¹ | single leaves | 1 |
| Full sunlight | about 2000 µmol m⁻² s⁻¹, about 400 W m⁻² PAR | direct sun | 1 |
| PAR absorbed by a leaf | 85% to 90% | 400 to 700 nm | 1 |
| Lettuce light compensation point | 36.2 µmol m⁻² s⁻¹ | romaine, grown at 250 µmol m⁻² s⁻¹, 12 h light, measured at 25 °C leaf temperature | 3 |
| Lettuce light saturation point | 1,056 µmol m⁻² s⁻¹ | same | 3 |
| Lettuce maximum net photosynthesis | 20.2 µmol CO₂ m⁻² s⁻¹ | same | 3 |
| Lettuce dark respiration | 2.5 µmol CO₂ m⁻² s⁻¹ | same | 3 |
| DLI from constant 24 h PPFD | PPFD × 0.0864 | 86,400 s ÷ 1,000,000 | 7 |
| Lettuce DLI target | 17 mol m⁻² d⁻¹ | butterhead, greenhouse, ambient CO₂; 150 g heads | 4,5,6 |
| DLI in the worked example | 10.8 mol m⁻² d⁻¹ | 250 µmol m⁻² s⁻¹ for 12 h | 3,7 |
| Atmospheric CO₂ | 360 ppm (0.036%); around 390 ppm | textbook; handbook | 1,6 |
| CO₂ in a closed greenhouse on a bright day | can fall to 100 ppm | plants depleting the air | 6 |
| CO₂ enrichment used for lettuce | 1,000 to 1,500 ppm | greenhouse | 6 |
| Fixed carbon lost to respiration | 30% to 60% of daily gain; 70% to 80% in the tropics | herbaceous species | 1 |
| Respiration temperature coefficient | about ×2 per 10 °C | 0 to 30 °C | 1 |
| Energy from one mole of sucrose | 5,760 kJ per 342 g | complete oxidation | 1 |
| O₂ in air-saturated water | about 250 µmol L⁻¹ (about 8 mg L⁻¹, derived) | 25 °C | 1 |
| Dissolved oxygen for lettuce | at least 4 ppm; ponds held at 8 ppm | Cornell deep-flow system | 6 |
Common mistakes
- Feeding more fertiliser to a plant that is short of light. Over 90% of dry matter is carbon, oxygen and hydrogen from air and water, so a light-limited plant cannot turn extra minerals into growth2.
- Judging a lamp by lux or by how bright it looks. Those scales follow the human eye’s green sensitivity, while photosynthesis counts photons between 400 and 700 nm1,7.
- Pushing light past the crop’s daily integral. Past saturation the leaf is CO₂-limited and gains nothing, and in lettuce more than about 17 mol m⁻² d⁻¹ brought tipburn in the Cornell trials1,5.
- Running a warm night. Respiration doubles for every 10 °C between 0 and 30 °C and continues in every cell while photosynthesis is switched off, so warm nights burn the day’s sugar1.
- Leaving a deep nutrient solution unaerated. Roots respire, oxygen diffuses slowly through water, and still water at 25 °C holds only about 250 µmol of O₂ per litre, so the roots exhaust it1.
Summary
Most of a plant is water, and most of the rest is carbon, oxygen and hydrogen taken from carbon dioxide and water, not from the roots. Photosynthesis joins them into sugar in two stages, the light reactions and the Calvin cycle, and light, CO₂ and temperature can each be the bottleneck. The light-response curve shows the pattern: a compensation point where uptake balances respiration, a linear light-limited range, and a saturation plateau where CO₂ becomes the limit. Only photons between 400 and 700 nm count, so light is measured as PPFD and summed over the day as DLI; lettuce lit at 250 µmol m⁻² s⁻¹ for 12 hours receives 10.8 mol m⁻² d⁻¹, below the 17 mol m⁻² d⁻¹ target from the Cornell greenhouse work3,4,7. Respiration is the reverse reaction, runs in every cell day and night, and consumes 30% to 60% of the carbon fixed each day, more when nights are warm1. Roots respire too, and because oxygen moves slowly through water a nutrient solution must be aerated.
Next in the series: Water in the plant: uptake, transpiration and humidity.
References
- Taiz, L. and Zeiger, E. (2002). Plant Physiology, 3rd ed. Sinauer Associates, Sunderland, MA. Chapters 5, 7, 8, 9 and 11.
- Resh, H. M. (2013). Hydroponic Food Production: A Definitive Guidebook for the Advanced Home Gardener and the Commercial Hydroponic Grower, 7th ed. CRC Press, Boca Raton. ISBN 978-1-4398-7869-9.
- Zhou, J., Wang, J. Z., Hang, T. and Li, P. P. (2020). Photosynthetic characteristics and growth performance of lettuce (Lactuca sativa L.) under different light/dark cycles in mini plant factories. Photosynthetica, 58(3), 740–747. https://doi.org/10.32615/ps.2020.013
- Both, A. J., Albright, L. D., Langhans, R. W., Reiser, R. A. and Vinzant, B. G. (1997). Hydroponic lettuce production influenced by integrated supplemental light levels in a controlled environment agriculture facility: experimental results. Acta Horticulturae, 418, 45–51. https://doi.org/10.17660/ActaHortic.1997.418.5
- Both, A. J. (undated, about 2003). Ten years of hydroponic lettuce research. Review article, Rutgers University, New Brunswick, NJ. https://www.haifa-group.com/sites/default/files/2024-03/AJBothTenYearsofHydroponicLettuceResearch2003.pdf
- Brechner, M., Both, A. J. and CEA Staff (2013). Hydroponic Lettuce Handbook. Cornell University Controlled Environment Agriculture Program, Ithaca, NY. https://cpb-us-e1.wpmucdn.com/blogs.cornell.edu/dist/8/8824/files/2019/06/Cornell-CEA-Lettuce-Handbook-.pdf
- Torres, A. P. and Lopez, R. G. (2010). Measuring Daily Light Integral in a Greenhouse. Purdue Extension publication HO-238-W, Purdue University, West Lafayette, IN. https://www.extension.purdue.edu/extmedia/ho/ho-238-w.pdf
This article was drafted with the help of AI tools and reviewed and edited by PonicLabs. Sources are listed above; tell us if you find an error.